Assignment 1: Graphs
Write-up: #3. Find two linear functions f(x) and g(x)
Key Points:
Click the Graphing Calculator File to run any of these problems.
Problem Statement
|
Find two linear functions f(x) and g(x) such that their product h(x) = f(x).g(x) is tangent to each of f(x) and g(x) at two distinct points. Discuss and illustrate the method and the results. |
|
Solution
Easiest way seems to be to assume lines are reflection across y axis, so slopes equal and negative of one another for the tangent lines, although there would be cases of this (seems) for the rotation of above figure.
|
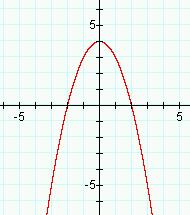
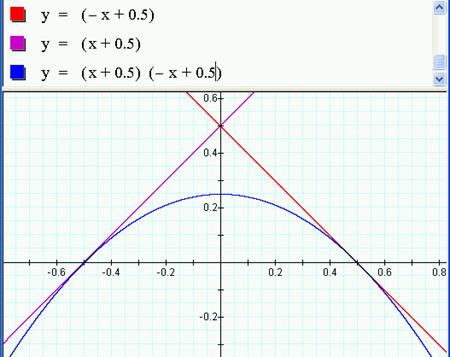
To help visualize parabolic of this shape, the following is one of simplest formulas y = (-x+2)(x+2). Now if lines are tangent to the parabola then slopes = and the (x,y) are equal at that tangent point. So we have y=mx+b and lets see if we can find matching lines for the simple parabola above. Taking derivatives for the line y'(-x+2) = -1 and parabola y'(-x^2+4) = -2x, so slopes are = at -1 = -2x ; so at x= ½ and -½. We just solve for b on lines by solving equations. We can't assume this event will actually be at the y=-x+2 line we modeled above, so we solve two equations knowing (x,y) are equal at this tangent point ( ½ , y) for both line and parabola. o Line is y = -x+b = - ½ +b. o for parabola y = - ½ ^2 + b^2 so setting equal and solving for b. b^2 –b = - ½ + ¼ = - ¼ . or (b- ½ b)^2 = 0, so b = ½ So tangent lines are really y = -x+ ½ and y = x + ½ Tryed on GSP below |
|
|
Seems to check out. |
|
Notes on Other Problems
1 . Examine:
![]() .
.
Call 4 the a variable
Call 1 the b variable
What happens if the a is replaced by other numbers (not necessarily integers)? Try 5, 3, 2, 1, 1.1, 0.9, -3. Any unusual event?
Changing a adjusts the x intercepts out to +/-
sqrt(number). Curves expand up (out) as
well.
Changing b adjusts the y intercepts out to +/- sqrt(number).
At a=b the graph is a line and an ellipse. (factor equations) when a-b>0 – ellipse expands for n>0.
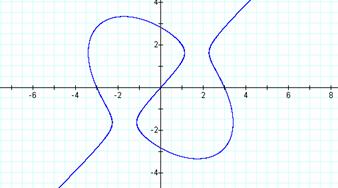
Interpret. What equation would give the following graph:
![]()
What happens if a constant is added to one side of the equation? Try several graphs in some systematic way. Click here for one set of graphs.
Try graphing
![]()
Click HERE
to open Graphing Calculator 3.2 to explore this equation.
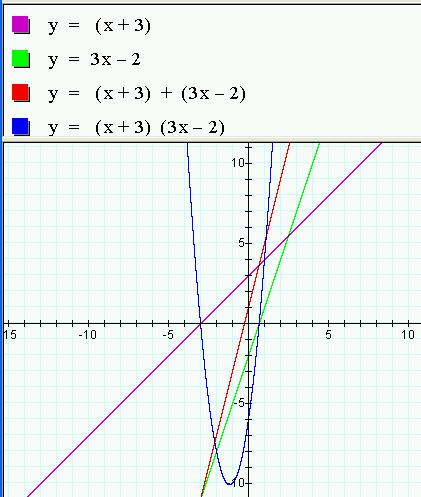
2. Make up linear functions f(x) and g(x).
Explore, with different pairs of f(x) and g(x) the graphs for
i. h(x) = f(x) + g(x)
ii. h(x) = f(x).g(x)
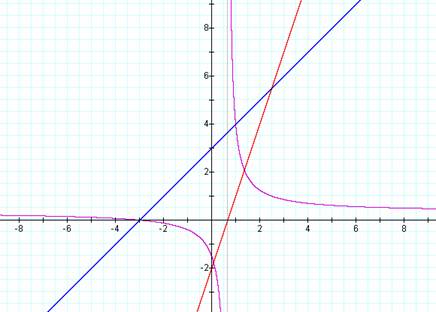
iii. h(x) = f(x)/g(x)
iv. h(x) = f(g(x))
Summarize and illustrate.
|
Lines of course follow expectations and addition of them gives average intercepts & slope. Multiplication of linear eq is more interesting. X & y intercepts predictable by solving for 0's. |
|
|
For division (x+3)/(3x-2) -> think about later |
|
3. Find two linear functions f(x) and g(x) such that their product
h(x) = f(x).g(x)
is tangent to each of f(x) and g(x) at two distinct points. Discuss and illustrate the method and the results.
See above
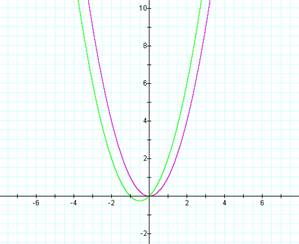
4. Repeat Problem # 3 above where f(x) and g(x) are quadratic functions
and each function, f(x) and g(x) is tangent to h(x) in two different points. That is, h(x) is a fourth degree equation and each of the second degree equations, f(x) and g(x) is tangent to h(x) in two points.
|
Use same basic logic as for
#3. Just explore to visualize a bit Assume no variable on main
quadratic again so F(x) or y = x^2 + ax + c: Do two simple equations first: y=x^2 + 1x+0, and y=x^2+ |
|
5. Examine graphs of
y = a sin(bx + c)
for different values of a, b, and c.
6. Graph
What do you expect for the graph of
![]()
or
![]()
7. Let f(x) = a sin(bx + c) and g(x) = a cos(bx + c).
For selected values of a, b, and c, graph and explore:
i. h(x) = f(x) + g(x)
ii. h(x) = f(x).g(x)
iii. h(x) = f(x)/g(x)
iv. h(x) = f(g(x))
8. Explore the following equation for different values of a.
![]()
Some examples:
| a = 0 |
| a = 1 |
| a = 3 |
| a = 5 |
| a =
10 |
| a =
-10 | | a = -3 |
| a =
-5 | | a = .10 |
| a =
.50 | | a = -.50 |
| a =
-.10 |
| Multiple
Graphs |
9. Consider two points (3,4) and (-5,-2). For any point (x,y) we can write the
distance equations for these as
![]()
![]()
Explore graphs with these two distance equations. For
example,
a. Consider when each is set to a non-zero constant. Circles are graphed.
b. Consider the sum
![]()
for various values of C.
c. Consider the product
![]()
for various values of C.
d. Other?
More
about Lemniscates