Investigate quardratic equation
By Na Young
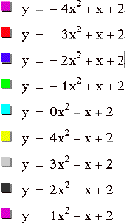
4. What happens to ![]() as a is varied?
as a is varied?
Let’s investigate the following graph.
Graph
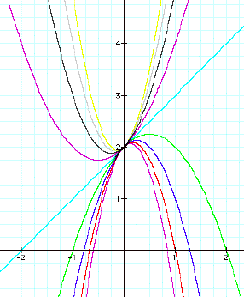
As a is varied from –4 to –1, the graph was made
in 3 and 4 quadrant
and as a is
varied from 1 to 4, the graph showed in 1 and 2 quadrant.
Being different
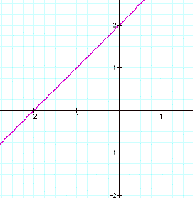
from other graph, as a=0, a graph is a line y=x+2.
Quadrants showing
the graphs are different from a’s sign.
Is there a common
point to all graphs?
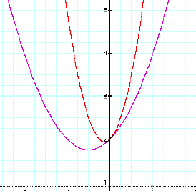
All graphs have a common point (0,2).
What is the significance
of the graph where a=0?
When a=0, this
graph is not quadratic formula and hence, not parabola.
It is one line
that a slope is 1 and passed by 2 in y-axis.
Each graph except
a=0 shows a parabola and as a’s sign, a graph’s shape is
Convex or
concave. Explicitly, for a>0, a graph’s shape is convex and
for a<0, it is
concave.
We can
investigate that a graph’s shape changed as values of a.
For example, a
graph of a=1 is less convex than a graph of a=4.
In the case of a<0, for
example, a graph of a=-1 is less concave than one of a=-3.
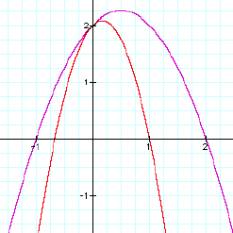
Generally, a graph of a=c(c>0) is
less convex than a graph of a=d (d>c).
On the contrary,
when a<0, this situation is similar. A graph of a=-c(c>0) is
less concave than a graph of a=-d (d>c).
That is, as |a| is increased,
a grape’s shape
is more convex (a>0) or more concave (a<0). The position of
a graph is that
for a>0, it shows in 1and 2 quadrant and for a<0, it shows
in 3 and 4
quadrant.
……………………………………………………………………..