
Investigation of the cubic
equation
By Na Young Kwon
Investigation 1.
Consider the equation
![]() _____(1)
_____(1)
To consider the equation (1)
we construct several graphs of
![]() ______(2)
______(2)
for different values of a, b, c and d .
From these graphs discussion
of the patterns for the roots of the equation (1)
Can be followed. For example,
if we set
![]()
for b=-3,-2,-1,0,1,2,3, and overlay the graphs, the following picture is obtained.


We can discuss the movement
of a curve as b is changed. The curve
passes through the same point on the y-axis (the point
(0,1) with this equation).
For b=-3, the curve
intersected the x-axis in three points with two positive
x values and one negative value(i.e. the original equation
will have three real
roots). In my investigation, for –2.7<b<-26, the intersection point is changed
from three to one. For –2<b<3, the curve intersected the x-axis in one point
with negative value.
Consider the extreme points of this curve. For –3<b<-2, the curve had
two extreme points with a
positive maximum value and a negative minimum value.
For –1<b<1, it had no
extreme point. For 2<b<3, it
had two extreme points
with a positive maximum and a negative minimum value.
Investigation 2.
Graphs in the xb plane.
Consider again the equation
Now we investigate the graph
of this relation in the xb plane.
We get the following graph.

If we take any particular
value of b, say b=3, and overlay this equation
On the graph we add a line
parallel to the x-axis. If it intersects the curve
In the xb plane, the
intersection points correspond to the roots of the
original equation for that
value of b. We have the following graph.

As value of b is changed, we can know a change of the roots
of the
Original equation. When
–2<b, we get one negative real root and
when –3>b, two positive
real roots and one negative real root.
For –3<b<-2, right one
of the graph is tangent to a
parallel line. In this
case, there is two roots with
one negative real roots and one positive root.
Let’s investigate when a
value of a and c are changing.


We find, as changing a value
of a, the left part of a graph is more closer in y-axis
and the right part of a graph
is far away more and more from an original point.
When a>0 and when a<0 ,
the graph is converse. In the case of moving a value of c,
we can find the similar
situation of changing a value of a.
Consider the case when d=-1
rather than +1.


We can know this graph is
symmetry to a graph of d=+1 by original point.
Investigation 3.
Graphs in the xc plane.
Consider the equation
![]()
Now we consider this graph in
the xc plane.
We get the following graph.

If we take any particular
value of c, say c=-2, and overlay this equation
on the graph we add a line
parallel to the x-axis. For c=-2, we get one
negative real root of the
equation.

Roughly saying, when
c>-2.5, there is one real root and when c<-3 one
negative real roots and two
positive real roots.
Let’s investigate the graph
as a value of a is changed.


Similar with the graph of![]() , this graph
are different in right and left graphs.
, this graph
are different in right and left graphs.
As a value of a is
increasing, the left graph of y-axis is closer to y-axis and the right graph
is far from the original
point.
Consider the case when d=-1
rather than +1.


In this case, the graph of
d=-1 is not symmetry to the graph of d=+1.
However, the asymptotic curve
is y-axis the same as the graph of d=+1.
Investigation 4.
Graphs in the xd plane.
Consider the equation
![]()
Now graph this relation in
the xd plane. We get the following graph.
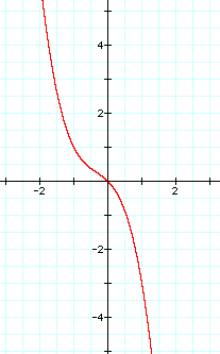
This graph is the graph of general cubic equation.
If we take any particular
value of d, we get one intersection point
(i.e. the original equation
has one real root). When d>0, there is
one negative real root, when
d<0, one positive real root and for d=0,
one real root x=0. This graph
has no local extreme value and symmetry to
original point. If a sign of
a is changed, a=-1, then the end of the graph is
increasing and this graph has
two extreme value with one local maxima
and one local minima. We can
find this truth and also see that a value of a is
changed by the following
graphs.


When b=0, the graph is
symmetry to the original point for any value of c.

…………………………………………………………………….
Return to Na Young’s Home page