Assignment 12
Investigation 2
Creating Graphs of Parametric
Equations on Spreadsheets
The spreadsheet
can be used to display the graph of parametric equations. One
way is to place an initial value of the parameter t in cell A1
and increment t in the A column. Then if we put the formula for
the x-coordinate, in B1 and the y-coordinate in C1, we can fill
down to get the appropriate range of t and then graph. Below are
some graphs of parametric equations using problems from assignment
10.
Lets start with the following
equation.

 Click HERE
to see the Excel file that was used to create this graph.
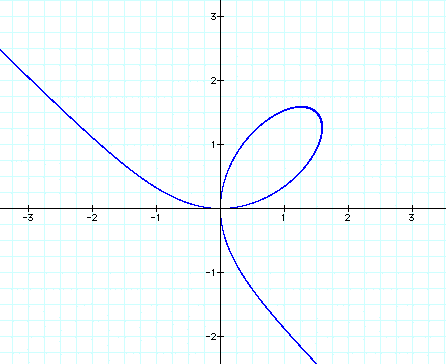
If we take another look
at our graph of the equation from Assignment 10, we see the two
graphs are the same.


 Click HERE
to see the Excel file that was used to create this graph.
Again if we take another
look at our graph of the equation from Assignment 10, we see the
two graphs are the same.

Return
to Assignment 12


