by Soo Jin Lee
4.Interpret your graphs. What happens to
(i.e., the case where b=1 and c=2) as a is varied? Is there a common point to all graphs? What is it? What is the significance of the graph where a = 0? Do similarinterpretations for other sets of graphs. How does the shape change? How does the position change?
1. First let's find out the common value to all graphs ,
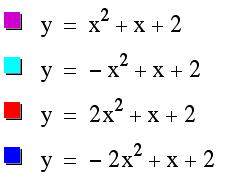

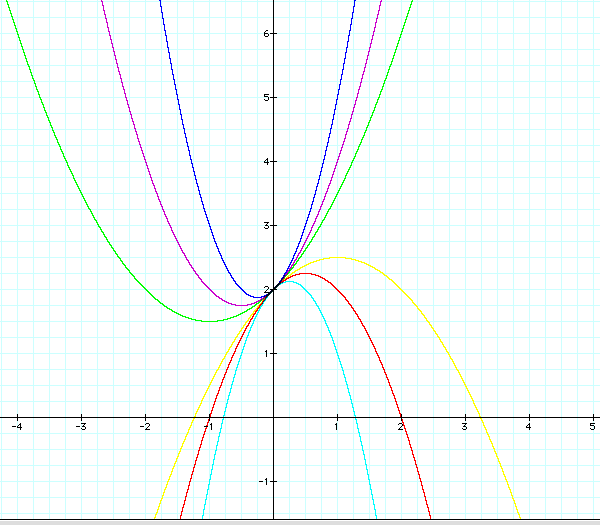
Since all the graph are having the quadratic formula, the shape if the graphs are parabola.
The common value to all these graphs is distinctively pointed above!
It is '2'!!!!!!
I can see the common value to all the quadratic formula is 'y-intercept'.
2. Now I want to see the significance of the
graph ![]() , when a=0
, when a=0
![]()
Since I want to see the effectiveness of this graph to all the graphs I've drawn above,
I will demonstrate whole graphs!
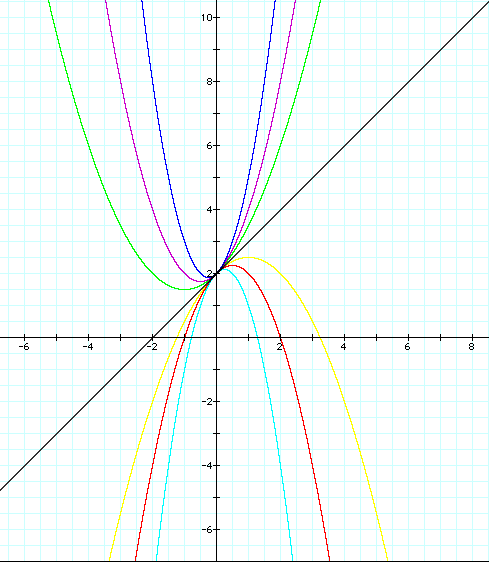
As I can clearly see through the graph, When a=0, this graph is not a parabola anymore, it is a linear equation so the graph is just the straight line having
tangent 1 and passing (0, 2).
However if a>0 or a<0, the graph will still be the parabola.
In addition, if a>0, the graph is convex and if a<o, the graph is concave.
so a=o is the turning point from convex graph to the concave graph.
3. Do similarinterpretations for other sets of graphs???
How does the shape changes? How does the position changes?
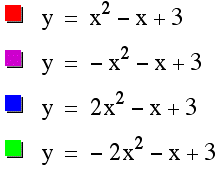
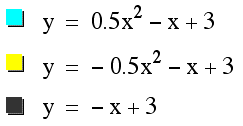
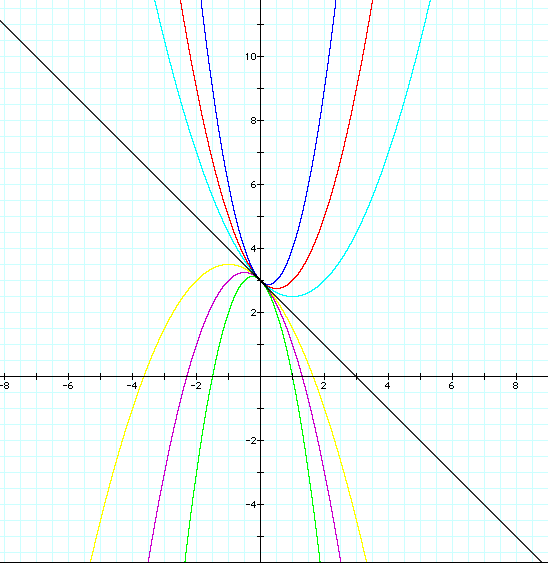
I draw similar graph to the first one, differences are now I shifted the positive x to negative x and I changed the y-intercept to '3'.
Now I have a little difference here,
The common value is '3' since I changed the y-intercept to '3'.
In addition, since y=-x+3 passes through 1,2,4 quadrant, concave and convex parabolas are now divided their positions by that stright line.
When a=0, it changed to the linear equation and this point will be the turning point which will change convex graph to the concave graph!
To see more,
click here.