
|
Problems addressed: 1,4,7,8 Cristina Aurrecoechea Fall 2005 |
We explore the following set of equations:
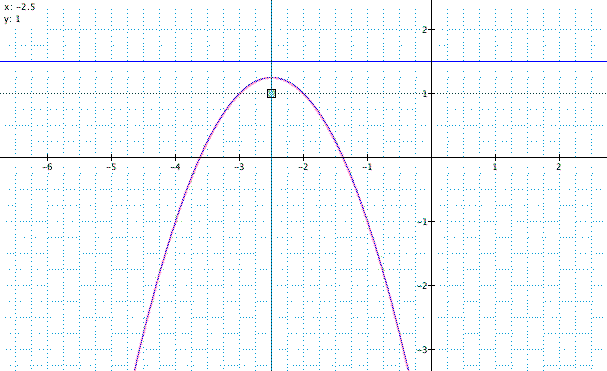
It corresponds to a family of parabolas with vertical axis of symmetry (therefore, parallel to the y axis). That means that for a given y = k, there could be 0, 1 or 2 points in the parabola. Figure 1 shows the parabola for a = -1, b = -5 and c = -5.

Observations:
For a given c value, if a is positive (parabola opens upwards), as b varies the parabola moves in such a pattern that when b = 0 we get the parabola with highest vertex (max. ordinate value). You can se this in Figure 2 for a = c = 1. Similarly when a is negative (opening downwards), b = 0 produces the parabola with lowest vertex.
Given a and c, the locus of the vertices of the set of parabolas generated as b varies is another parabola whose vertex is the vertex of the original parabola for b = 0, which is (0,c). (This is also observed by Prof. Wilson in Assignment #3, Investigation 1).

Figure 2 shows the family: ![]() ,
and the locus of vertices is on the parabola:
,
and the locus of vertices is on the parabola: ![]() .
.
In general the equation of the parabola that
is the locus of the vertices of the parabola ![]() when varying b, is:
when varying b, is:
To confirm these observations we have prepared a gcf file that will allow you to explore parabolas with the integer values of a,b and c between -5 and 5 (to explore rational values just remove the floor function from the parameters).
Next let's obtain the focus and directrix
of a parabola ![]() . By
doing some algebra we can change the shape of the equation so
it looks like:
. By
doing some algebra we can change the shape of the equation so
it looks like:

Given this parabola equation we know the vertex is at (h,k) and that the directrix and the focus are |p| units distant from the vertex. The equation of the directrix is then y = k - p (parallel to the x axis) , while the focus is at (h , k+p).
For the parabola in Figure 1 , ![]() , you can check that: k = 5/4 , h = -5/2, and p = -1/4. Therefore
the directrix is y = 1.5 and the focus is at (-2.5,
1). These are shown in Figure 3.
, you can check that: k = 5/4 , h = -5/2, and p = -1/4. Therefore
the directrix is y = 1.5 and the focus is at (-2.5,
1). These are shown in Figure 3.

It is not difficult to obtain the relations between a, b, c and h ,k, p:
 |
 |
 |
Since p only depends on a, both have the same effect on the parabola, that is, how much/fast it opens and if it opens upwards or downwards.
This next gcf file will allow you to visualize different parabolas by setting the vertex (h,k) and p.
Figure 4 is the 3D projection of the parabola in Figure 1; it shows its intersection with the plane z = 0.

To visualize a parabola in 3D and explore different equations, check this gcf file.
Return to Cristina's page with all the assignments.