Assignment 12
Introduction:
In the United States, the price of a first class postage stamp for US Mail has increased since the beginning of the twentieth century. This investigation will use Mircrosoft Excel to make predictions about the cost of a stamp in the future.
Investigation: This data set is based on the first class letter postage for the US Mail from 1933 to 1996. Plot the data and develop a prediction function. Answer the following questions:
- When will the cost of a first class postage stamp reach $1.00?
- When will the cost be 64 cents?
- How soon should we expect the next 3 cent increase?
|
|
Price (in cents) |
| 1919 | 2 |
| 1932 | 3 |
| 1958 | 4 |
| 1963 | 5 |
| 1968 | 6 |
| 1971 | 8 |
| 1974 | 10 |
| 1975 | 13 |
| 1978 | 15 |
| 1981 | 20 |
| 1985 | 22 |
| 1988 | 25 |
| 1991 | 29 |
| 1994 | 32 |
| 1997 | 33 |
| 1999 | 34 |
| 2002 | 37 |
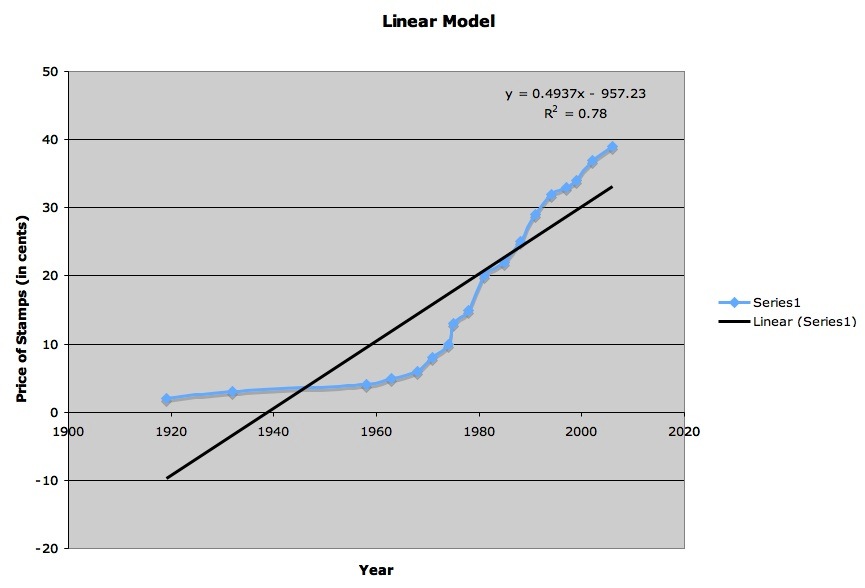
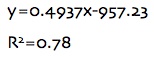
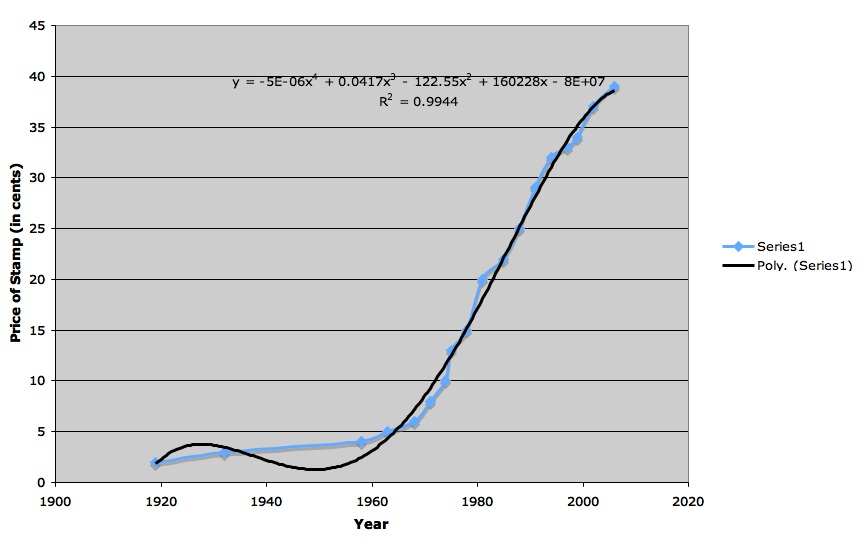
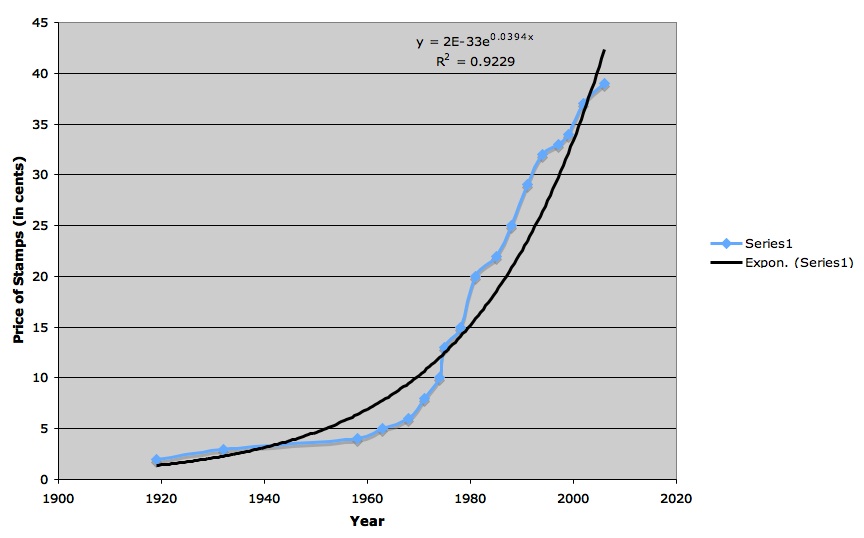
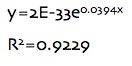
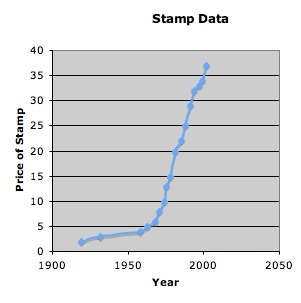
To begin my exploration, I used linear, polynomial, and exponential models to develop various prediction functions. By observing and analyzing this information, I can choose the most accurate model to make make my predictions.