 be an angle measured
counterclockwise from the x-axis along an arc of the unit
circle. Then sin is the vertical coordinate of the arc endpoint.
As a result of this definition, the sine function is periodic
with period
be an angle measured
counterclockwise from the x-axis along an arc of the unit
circle. Then sin is the vertical coordinate of the arc endpoint.
As a result of this definition, the sine function is periodic
with period  .
.Examine graphs of
for different values of a, b, and c.
Have you drawn sine curve?
Let
be an angle measured
counterclockwise from the x-axis along an arc of the unit
circle. Then sin is the vertical coordinate of the arc endpoint.
As a result of this definition, the sine function is periodic
with period .
In upper applet, observe the sine graph by pressing 'Trace' button. (If you press '0 degree', the blue point goes to origin.)
Next graph is the sine function.
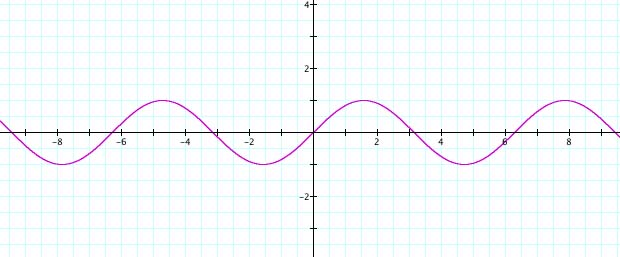
As
you can see, the domain of the sine function is the set of all
real numbers, and the range is the set { y : y is
a real number such that -1 y 1 }.
Thus, the maximum value is 1 and the minimum value is -1.
Now let's explore the graph of y = a sin x .
Upper movie shows the graph of function y = a sin x as 'a' changes from -5 to 5.
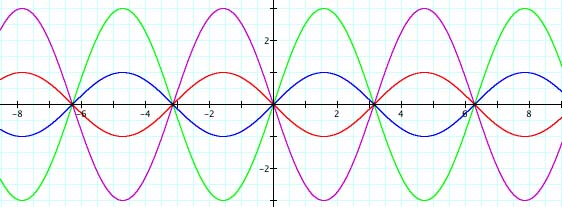
In upper graphs, the purple one is y = -3 sin x, the red one is y = - sin x, the blue one is y = sin x, and the green one is y = 3 sin x.
As the absolute value of a is getting bigger, the amplitude of graph is getting bigger.
Since
-1 sin x 1 ,
a sin x
a
If you want the graphic calculator file of above graph, Click Here!
Next, let's examine the graph of y = sin bx .
Upper movie shows the graph of function y = sin bx as 'b' varies from -5 to 5.
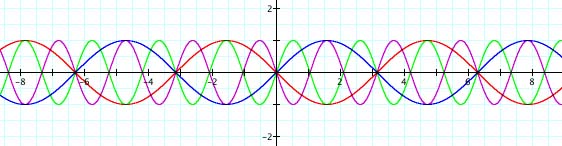
In upper graphs, the purple one is y = sin(-3x), the red one is y = sin(- x), the blue one is y = sin x, and the green one is y = sin 3x.
As the absolute value of 'b' is getting bigger, the period of function y = sin bx is getting smaller.
For
y = sin bx to complete one cycle, bx
should vary from 0 to .
Thus,

If b>0,
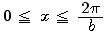 .
.Therefore,
the period is  .
.
If b<0,
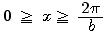
Therefore,
the period is 0-=
- .
Using
absolute value notation, the period of y = sin bx
is  .
.
If you want the graphic calculator file of above graph, Click Here!
Finally, explore the graph of function y = sin (x + c).
Upper movie shows the graph of function y = sin (x+c) as 'c' varies from -5 to 5.
As you can see, the graph is shifting as the value of c varies.
In fact, the graph of function y = sin (x+c) is to translate the graph y = sin x by -c along x-axis.
In
sum, the graph of y = a sin (bx + c) is that its
amplitude is a, and its period is . Also, it is to translate the graph y =
a sin bx by -c/b along x-axis since y = a
sin b(x + c/b).
Following file is to examine the graph of y = a sin (bx + c) made by GSP.
After
download, vary the length of a, b, or c. Click
Here to Download!