| This is the write-up of Assignment #2 |
Brian R. Lawler
|
| EMAT 6680 |
12/8/00
|
The Problem
For classroom demonstration, is it better to graph 5 graphs at once or produce them in sequence adding one at a time? What are the pedagogical implications of this observation?
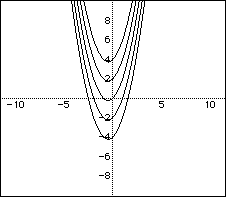
Example classroom investigation: Fix two of the values for a, b, and c. Make at least 5 graphs on the same axes as you vary the third value. For example,
 |
 |
|
|
|
The example classroom investigation is interesting to me. I have worked with students to develop explorations into the roles the coefficients of the standard quadratic equation y = ax2 + bx + c have in determining the shape and location of the graph. Students understood that second degree functions seemed to always produce parabolas (or informally smiles and frowns). Further, they had some notion that the coefficients played a role in shape and location from their previous experience with graphs of functions, mostly linear.
While a portion of the task for the students was to come to some conclusions (and present their findings) regarding the effects of a, b, and c, they also faced the task of designed a purposeful investigation that would help them answer the question. Without many more details, most every student constructed accurate discussions of the impact of a and c. Further, most could discuss why a and c had these effects on the graph. (Click here for a very quick summary of the effects of a and c.)
However, while the students could describe to varying degrees the effect of coefficient b, few put together what I considered complete arguments (i.e. proofs) as to why their findings were so.) So, from this context, on to considering the questions at hand...
I believe that the teacher, for the purpose of motivating the interest in exploring b or in helping to design an investigation to explore the effects of b, would be most effective by presenting one quadratic with a particular value of b at a time. The teacher may begin with seemingly simple example, one in which the students know what the a and c coefficient will do. (On all graphs below, you may click on the image to download the original file for your investigation.)
Encourage students to request alternative values of b, again graphing one value at a time. Soon, I suspect it is likely that students may ask to see more than one at once in order to compare. At this point, it may be better to show several graphs at one time.
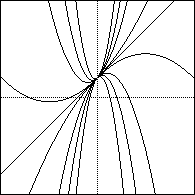
As students begin designing this strategy, the teacher may attempt to challenge the completeness of the strategy by injecting a question that will bring out the interference a and/or c may play in the patterns students are observing. For example, show several graphs at once that seem to be (somewhat) contradictory to the conjectures students may have so far.
Now, the intent of demonstrating the graphs has changed. In this case, it may be more effective for the purpose of motivating student's testing of conjectures to show all at once.
Clearly, the answer to these questions lie in the intent of the instructor. And the intent of the instructor should reflect what he/she knows about the students current knowledge and the goals the instructor has set for the student.
A final comment concluding this investigation. The power of the computer software Graphing Calculator 3.0 allows students to animate a changing b value. They can observe the path it slides the quadratic along and may make conjectures about that path, such as it may be quadratic itself!
Reflections
Inherent in this question is a role the teacher plays in a classroom. This question seems to presuppose the teacher is in a role of demonstration. A teacher may be demonstrating to motivate children's curiosity, to introduce a concept, or to explain a concept. [That is not intended to be a fully thought out list.] Certainly every learning situation - instructor, students, environment, motivation, prior knowledge, ... - will be unique. But as a sweeping generalization, I believe that of the three purposes I suggest, the first may be the most effective method to promote learning. However, I harvest great doubts that in many contexts the teacher demonstrating is ever the "most effective" way to promote learning. If a teacher can let go of his/her ego or enjoyment of showing off and would allow the same experience top be generated by children - by their own hands on their own keyboards with their own creation of various scenario's to explore the effects of the coefficient b (for example), is by far and away the learning environment that will produce the greatest learning for that child. Learning about b, learning about the geometric structures of functional relationships, learning about mathematical reasoning, learning about themselves as learners, and learning about their power to influence and control their lives.
I guess my message is, poor question. It accepts too much about what must be the role of the teacher and the learner and does not question or push for what could (should) be.
I quickly gathered a bit of information to help begin further exploration into the various roles the teacher may take in a technology enhanced classroom:
| Bridging Teacher vs. Student Centered |
http://www.marietta.edu/~johnsong/ |
| An Interesting Schematic | http://www.itc.iastate.edu/instrdev/ teleteach/appendB.html |
| A Comparison | http://www.cl.uh.edu/soe/cem/sttea.html |
 |
Comments? Questions? e-mail me at blawler@coe.uga.edu |
| Last revised: December 28, 2000 |
|