Directions: There are 20 problems worth a half point each on this assignment. Use Graphing calculator to graph each linear inequality that is given. Then, save your answers to your disk and turn in your diskette when you are finished. The problems should be saved using the problem numbers.
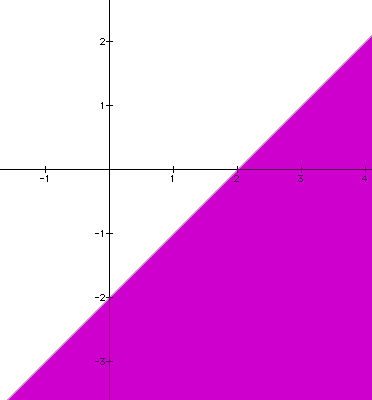
When these are worked correctly, one should get a graph that looks like the following.
The graph of the inequality, y < x - 2, should look like:

click here to open a graphing calculator program with this example already done.
Problems:
A10B#1) y < x + 1
A10B#2) y > -x + 2
A10B#3) y > 2
A10B#4) x < -2
A10B#5) y < 2x - 5
A10B#6) y > -.5x + 1
A10B#7) y < 5x - 10
A10B#8) y > -3x + 6
A10B#9) y < 2x + 1
A10B#10) y > 3x
A10B#11) y > -.3x - 2
A10B#12) y < -4x + 1
A10B#13) 5x y < 3
A10B#14) 4x + y > 0
A10B#5) 3x + 2y < 6
A10B#16) x y > -3
A10B#17) 3x + 3y < 0
A10B#18) 3x y > -3
A10B#19) 4x + y > 2
A10B#20) 2x y <
4