Teaching Notes:
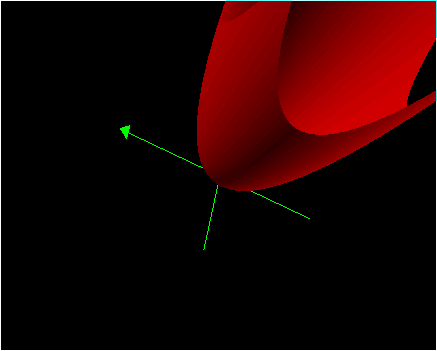
This lesson will probably be the most interesting to students. Graphing Calculator is an outstanding tool for helping students visualize 3-D graphs, since it allows them to "move around" the graph and see it from all sides by clicking and dragging the mouse. This lesson is similar to Day 7, in that the goal is simply for students to familarize themselves with the shape of both elliptic and hyperbolic (saddleshape) paraboloids. Please note that the pictures provided are not a good substitute for using the Graphing Calculator software to graph and view these paraboloids.
Definitions:
There are two different types of paraboloids: elliptic and hyperbolic. You may have heard hyperbolic paraboloids referred to as saddleshapes or saddleshape paraboloids.
Equation of a Paraboloid: z = ax2 + by2 + c
An Elliptic Paraboloid occurs when "a" and "b" have the same sign.
A Hyperbolic Paraboloid occurs when "a" and "b" have different signs.
Elliptic Paraboloids:
Graph: z = x2 + y2

Graph: z = -x2 - y2

Graph: z = x2 + y2 + 3

Graph: z = 2x2 + 2y2

Hyperbolic Paraboloids:
Graph: z = x2 - y2

Graph: z = -x2 + y2

Graph: z = 2x2 - 2y2

Wrap-Up:
At this point, students should be able to classify a paraboloid as "elliptic" or "hyperbolic" based on its shape.