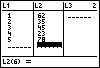
| Let's begin by entrering data into lists 1 and 2. |
 |
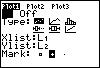
| Be sure that Stat-Plot 1 is on and looks like this screen. |
 |
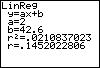
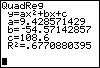
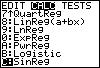
| Now, press the following sequence of keys: STAT, right
arrow, 4, and ENTER. These keystrokes perform a
linear regression model on our data. Notice we get our a and b values
as well as our correlation coefficient and coefficient of determination.
If your screen doe not look like this, press 2nd, 0, and
choose DIAGNOSTICON, then press . When the screen says
DONE, perform the regression steps again. |
 |
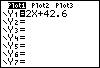
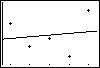
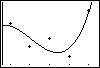
| We can insert our new equation into the y= menu by using the following
key strokes. First press Y= and clear any old equations you
see. Next press the VARS button then option 5.
Press the right arrow twice to highlight the EQ option,
and choose option 1 RegEQ. Your screen should look like the
following. Notice that our linear model does not seem to fit the
data really well. |
  |
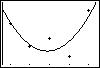
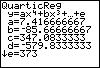
| Use the stat calc menu to perform a quadratic line of best fit.
Follow the same directions as above except choose the QuadReg option on
the menu screen. Still our results are not fully acceptable. |
  |
| Try again with cubic regression. It seems that we are getting
closer. |
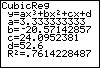  |
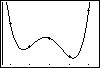
| Finally! We found a curve that seems to fit the data very well. |
  |
| You can also perform quite a few other types of regression models with
the TI-83 Plus. Try them on your own. |
 |