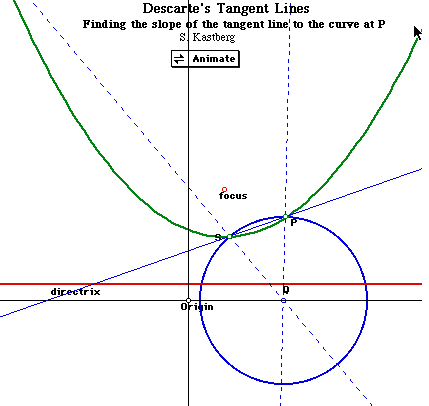

Many thanks to Dr. Roy Smith, professor of mathematics at the University of Georgia for motivating me to investigate polynomials and then showing me how tangent lines to curves of polynomials can be investigated with simple algebra and geometry.
Many thanks to Dr. J. Wilson, professor of mathematics education at the University of Georgia for showing me how to trick Geometer's Sketch Pad into showing tangent lines to parabolas.
So you think you need to know limits to find the slope of the tangent line to the curve at a point. A little foray into history will produce a contradiction to that assumption. We all know that Rene Descartes was a prolific mathematician. What you may not know that he developed the first methods for finding equations of tangent lines to polynomial curves. Descartes deep understanding of polynomials in two variables and the geometric behavior of these polynomials produced an early method for finding tangent lines to these polynomial curves. But before we look at that let us think a bit about polynomial equations in two variables and their graphs. In particular we will explore parabolas.
Well that didn't take long. This collection of polynomials is a bit more interesting. What geometric objects are produced when polynomials in this collection are graphed in the Cartesian plane, provided a, b, and c are not all zero? Descartes was a brilliant man since it turns out that equations of this form produce
Hence all the conic sections, that are usually explained by
examining sections of a cone, are simply manifestations of the
equation ![]() .
.
Consider the graph of the equation ![]() , where
A = 1, D = 0, E = -1, and F = 0.
, where
A = 1, D = 0, E = -1, and F = 0.

which is the graph of a parabola. By changing the coefficients A, D, E, F a variety of parabolas can be produced.
For example consider the following graphs and equations. Can you tell which equation corresponds to each graph?
1. ![]()
2. ![]()
3. ![]()

Question: Changing the coefficient, E, of y has an effect on the parabola. What is the effect? Does it make a difference when E is negative? Generalize. How do the other coefficients D and F effect the parabola? Generalize for each coefficient. For example graph
1. ![]() and vary D
and vary D
2. ![]() and vary F.
and vary F.
Consider the graph of the equation ![]() , where C = 1,
D = -1, and E = F = 0.
, where C = 1,
D = -1, and E = F = 0.

which is again the graph of a parabola with a different orientation. By changing the coefficients C, D, E, F a variety of parabolas can be produced.
For example consider the following graphs and equations. Can you tell which equation corresponds to each graph?
1. ![]()
2. ![]()
3. ![]()

Question: Changing the coefficient, D, of x has an effect on the parabola. What is the effect? Does it make a difference when D is negative? Generalize. How do the other coefficients E and F effect the parabola? Generalize for each coefficient. For example graph
1. ![]() and vary E
and vary E
2. ![]() and vary F.
and vary F.
This is a picture of the rotated parabola just in case you can not access the GSP file.

What is the general form of the equation ![]() that
produces such a parabola?
that
produces such a parabola?

Another form of the equation is ![]() . This is one example
of a rotated parabola. Certainly there are others. We still do
not have a general form. Can one be developed?
. This is one example
of a rotated parabola. Certainly there are others. We still do
not have a general form. Can one be developed?
Suppose we want to rotate the graph of ![]() ,
,![]() radians
as in the picture below.
radians
as in the picture below.

To do so, we simply substitute ![]() and
and ![]() into
the original formula in the form
into
the original formula in the form ![]() .
.
Now that we have the subsitution formula we can rotate any
parabola including those of the form ![]() .
.
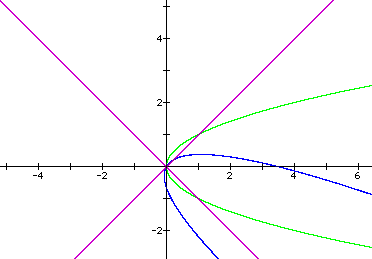
For example consider the parabola ![]() , the green graph
below. Suppose we want to rotate it
, the green graph
below. Suppose we want to rotate it ![]() radians. Subsituting
our rotation coordinates we have
radians. Subsituting
our rotation coordinates we have ![]() . Which becomes
. Which becomes![]() ,
the blue graph.
,
the blue graph.
Consider the equation ![]() the graph of which is a parabola.
the graph of which is a parabola.
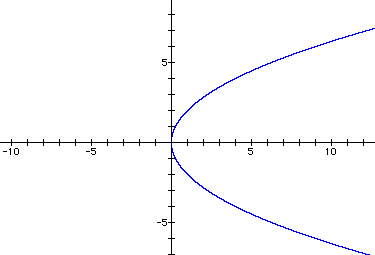
Suppose that we want to find the slope of the tangent line to the curve at the point (1,2). Notice that if we can construct a circle that is tangent to the parabola at the point (1,2) the slope of the tangent line through the same point would be the negative reciprocal of the slope of the line through the radius of the circle.
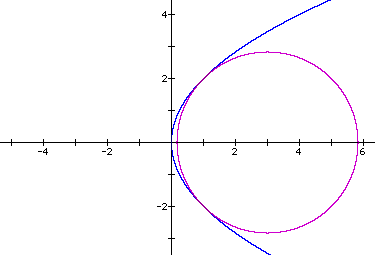
So how can we find the tangent circle? Consider the diagram below
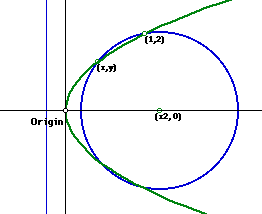
We would like to find the point on the x-axis, (x2,0) where the distance, d1, between the points (x2,0) and (1,2) is equal to the distance, d2, between (x2,0) and (x,y). When d1 = d2 the (x,y) = (1,2) and we will have the tangent circle needed. To find the point (x2,0) consider
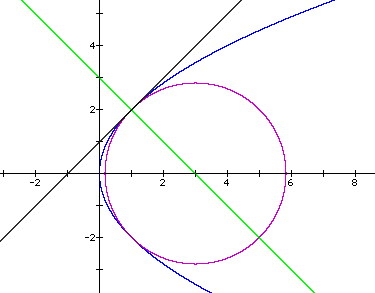
The green line in the graph above is the line y = -x + 3 through
the points (3,0) and (1,2) and the black line is the line tangent
to the curve ![]() at the point (1,2). Since the radius of the
circle is perpendicular to any tangent to the circle we know the
tangent line has slope 1 and the equation of the tangent line
is y = x + 1.
at the point (1,2). Since the radius of the
circle is perpendicular to any tangent to the circle we know the
tangent line has slope 1 and the equation of the tangent line
is y = x + 1.
