http://www.john-weber.com
Class Activity #3
Given a normal distribution with μ = 36 and σ = 3.4, find the following:
- Find and sketch the area under the normal curve for the following conditions:
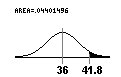
- x > 41.8.
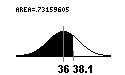
- x < 38.1.
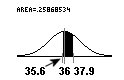
- 35.6 < x < 37.9.
- Find and sketch the area under the normal curve for the following conditions:
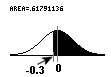
- z > –0.3.
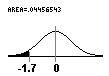
- z < –1.7.
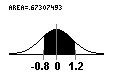
- –0.8 < z < 1.2.
- Why is the standard normal distribution needed/used?
- For what value of x is 57% of the area under the normal curve to the right? Sketch the area.
- For what value of z is 32% of the area under the normal curve to the left? Sketch the area.
ANSWERS:
- The area under the normal curve is found by using NDAREA program on TI-83 calculator:
- The area under the normal curve is found by using NDAREA program on TI-83 calculator:
- The standard normal distribution is used to compare all normal distributions.
- Use invNorm() function on TI-83. invNorm(0.43, 0, 1) = –0.176.
The graph is: 
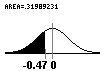
- Use invNorm() function on TI-83. invNorm(0.32, 0, 1) = –0.468.
The graph is: