 . The linear regression model for
this data is:
  = –0.45 x + 1096. Thus, the predicted winning time
for the 1992 Olympics is:
  = –0.45 (1992) + 1096 = 205 seconds.
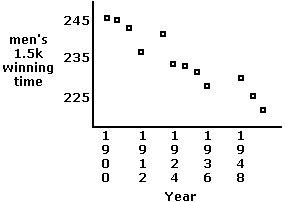
Given below are the winning times in seconds for the menís 1500-meter run in the Olympics from 1900 to 1968:
| Year, x | 1900 | 1904 | 1908 | 1912 | 1920 | 1924 | 1928 | 1932 | 1936 | 1948 | 1952 | 1956 | 1960 | 1964 | 1968 |
| Time, y | 246.0 | 245.4 | 243.4 | 236.8 | 241.8 | 233.6 | 233.2 | 231.2 | 227.8 | 229.8 | 225.2 | 221.2 | 215.6 | 218.1 | 214.9 |
Adapted from http://www.uoregon.edu/~qmshao/fall98/243ch2.pdf
ANSWERS:

 . The linear regression model for
this data is:
  = –0.45 x + 1096. Thus, the predicted winning time
for the 1992 Olympics is:
  = –0.45 (1992) + 1096 = 205 seconds.