| Steps |
Key Sequence |
Screens |
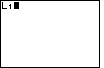
| 1. Enter sample1 data into list, L1 |
|
|
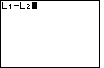
| 2. Enter sample2 data into list, L2 |
|
|
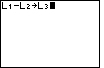
| 3. Enter differences into list, L3 |
2nd, then 1 (for L1) |
 |
| |
–, then 2nd, then 2 (for L2) |
 |
| |
Press STO, then 2nd, then 3 (for L3) |
 |
| |
ENTER |
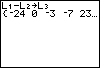 |
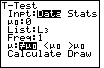
| 3. Perform one sample t test using Data with μ0 = 0,
List, L3, and appropriate test |
|
 |
| |
|
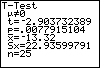 |
| In this case, the test was Ha: μ ≠ 0; the one–sample
t statistic is –2.904; the p–value is 0.0078; the sample mean is –13.32; the sample
standard deviation is 22.936 and the sample size is 25. |