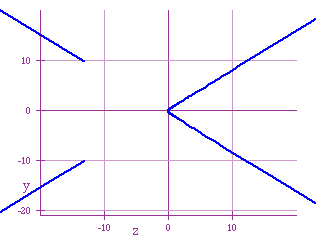

The following graph was taken from -2 < h < -1:

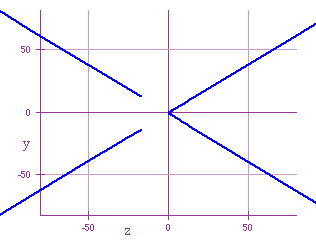
The next one was taken from -8.5 < h < -8.0:

Now, for values of h near to and bigger than 9, the lft side of the graph
goes to the left very fast (notice the change of scale):

Note that the right 'arm' of the graph is 'continous'.
For -1< h < 0, I got the following graph

In this family of graphs, for h negative, there are going to be points
of discontinuity given by those values of t that makes x and y to be undefined
(because the denomiator becomes 0, at![]() in each expression). Now,
for h = -1, we get a vertical line, because in that case, x = -1 always:
in each expression). Now,
for h = -1, we get a vertical line, because in that case, x = -1 always:

Observe also, that for these values of h, while the vertex of the right
arm of the graphs goes towards 0, the vertex of the other one is going far
to the left, and very fast:


The left 'arm' has disappeared, and the right arm has a hole, and the
hole is not at zero. What value of x is it? Checking at ![]() , we get
, we get ![]() .
A better zoom shows that this is the case.
.
A better zoom shows that this is the case.
So for negative values of h, we get intervals where the function is undefined.

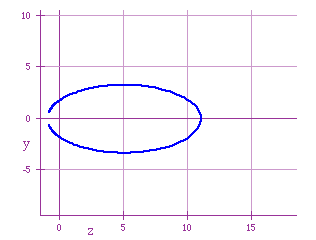
Observe that we got again our inverted c. For values of h near to 0,
we get:

So we are getting a kind of ellipse, with a hole.
For h > 1 we got:

The greater h, the smallest the graph (Notice the change of scale!).
It has a kind of parabolic shape; for increasing values of h the 'vertex'
seems to approach to 0. The points where the graph 'ends' vary depending
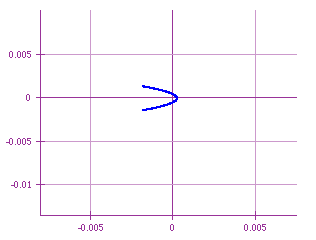
on h, getting also closer to 0. Will this approach indefinitely to 0? The
next graph shows what happens for h > 10000:

The similar conclusion is obtained directly from the expressions that
define x and y; since h is in the denominator of both fractions, a large
value of h will make x and y be closer to 0.