| Steps |
Key Sequence |
Screens |
| 1. Enter independent data into list, L1 |
|
|
| 2. Enter dependent data into list, L2 |
|
|
| 3. Calculate regression model (e.g., linear regression model: steps 4 & 5) |
|
|
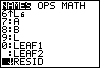
| 4. Store residuals in L3 (Note that the TI-83 automatically calculates the residuals
with the regression models) |
Press STAT |
 |
| |
1 |
 |
| |
Move cursor right to L3 then move cursor up so that L3 is highlighted |
 |
| |
Press 2nd then STAT |
 |
| |
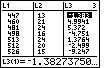
Scroll down until RESID is highlighted |
 |
| |
ENTER |
 |
| |
ENTER |
 |
| Steps |
Key Sequence |
Screens |
| 5. Set options for graphing window |
Press 2nd then FORMAT |
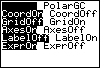 |
| * Make sure that CoordOn and AxesOn are highlighted |
| 6. Make scatterplot with L1 and L3 |
|
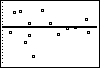 |
| 7. You can make a boxplot of the residuals (i.e., L3) |
|
 |
| 8. You can find the summary statistics of the residuals (i.e., L3) |
|
 |