
Lesson #6: Sine and Cosine Curves
By Rebecca Adcock
In Lesson #5: Unit Circles, we built a unit circle from triangles and saw a
connection between the unit circle and the sine and cosine functions. The unit
circle is not a graph of the sine and cosine functions in the same way that a
quadratic equation can be expressed by a parabola.
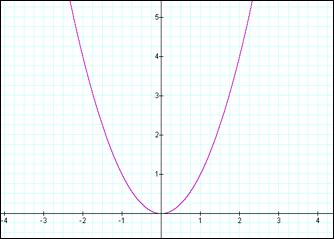
For example: The parent
function ![]() is represented
by the graph below…
is represented
by the graph below…
So what does a sine graph or
a cosine graph look like? There are several ways to find out. If you have no
tools at hand except a pencil and paper then you’re stuck cranking out the
graph manually. To do this, look at the unit circle and build the values from
the unit circle into tables.
|
Degrees |
0 |
30 |
45 |
60 |
90 |
120 |
135 |
150 |
180 |
210 |
225 |
240 |
270 |
300 |
315 |
330 |
360 |
|
Radians |
0 |
|
|
|
|
|
|
|
|
|
|
|
|
|
|
|
|
|
sin q |
0 |
|
|
|
1 |
|
|
|
0 |
|
|
|
-1 |
|
|
|
0 |
|
sin q to nearest tenth |
0 |
0.5 |
0.7 |
0.9 |
1 |
0.9 |
0.7 |
0.5 |
0 |
-0.5 |
-0.7 |
-0.9 |
-1 |
-0.9 |
-0.7 |
-0.5 |
0 |
|
cos q |
1 |
|
|
|
0 |
|
|
|
-1 |
|
|
|
0 |
|
|
|
1 |
|
cos q to nearest tenth |
1 |
0.9 |
0.7 |
0.5 |
0 |
-0.5 |
-0.7 |
-0.9 |
-1 |
-0.9 |
-0.7 |
-0.5 |
0 |
0.5 |
0.7 |
0.9 |
1 |


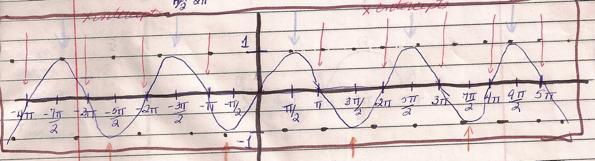
Now get out your graph paper
and draw the graph. Here’s one I did for sine. I sketched this one using
x-values in multiples of ![]() .
.
Here’s what Graphing
Calculator does with sine and cosine. It’s a lot prettier than my crude drawing
and a lot easier too. Compare points on this graph with some of the entries
from our table above.
Cosine….
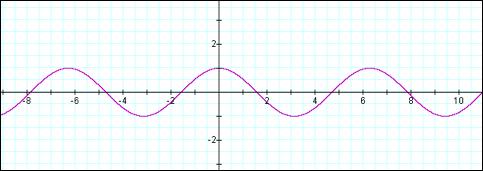
And sine….
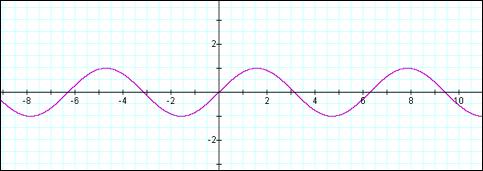
You get the idea of what the
graphs look like. They look very similar at first glance. Both graphs have some
very obvious attributes. For example, the curve never goes above 1 or below -1
on the vertical axis. Sine crosses thorugh the origin and cosine doesn’t. The
curves repeat continuously. Since I just used the word ‘repeat’ , I guess this
is a good time to define a periodic function. “If the values of a function are
the same for each given interval of the domain, the function is periodic.” In
other words, the graph appears to repeat after a first unique interval. The
unique interval for sine and cosine is ![]() .
.
Check out this website for
some examples of periodic and non-periodic functions. Use the browser’s back
arrow to return to this page.
http://www.indiana.edu/~gasser/E105/period_math.html.
Well, we’ve seen a crude
drawing of a sine curve and we’ve seen graphs created by software. Here are
more entertaining ways to see how the unit circle can create sine and cosine
curves.
This one is courtesy of Key
Curriculum Press. Clicking on this
one will take you to another website. To return to this page, use the browser’s
back arrow……
http://keypress.com/sketchpad/javasketchpad/gallery/pages/sine_waver.php
Before we end this lesson,
let’s list the properties of the graph of
![]() .
.
·
The period is ![]() .
.
·
The domain is the set of
all real numbers.
·
The range is the set of
real numbers between -1 and 1 inclusive.
·
The x-intercepts are
located at ![]() .
.
·
The y-intercept is zero.
·
The maximum values of
the function are ![]() and they occur when
and they occur when ![]() .
.
·
The minimum values are ![]() and they occur when
and they occur when ![]() .
.
Check
your understanding. See Lesson #6 in Lesson
Assessments.
Return
to Main
Menu.
.