In the first lesson, the Woos need to decide how many dozens of each kind of
cookie to make for the following day.
Here is what we know:
Plain cookies: requires 1 Lb. of cookie dough per dozen; takes 0.1 hrs.
of prep. time per dozen
Iced cookies: requires 0.7 Lb. of cookie dough and 0.4 Lb. of icing per
dozen; takes 0.15 hrs. or prep. time per dozen.
Here are their limitations:
- they only have 110 pounds on cookie dough and 32 pounds of icing on hand
-they only have room to bake 140 dozen cookies for tomorrow
- they only have 15 hrs. for cookie prep.
How much profit will they make on each type?
-They will get $6 for each dozen of plain cookies they sell and it costs
them $4.50 a dozen to make them.
-They will get $7 for each dozen of plain cookies they sell and it costs
them $5 a dozen to make them.
We want to know how many dozens of each type of cookie should be made in order
to maximize profit.
We may want to start out with finding combinations that will satisfy the
given conditions:
80 dozen iced -- 12 hrs.
30 dozen plain -- 3 hrs.
110 dozen total -- 15 hrs. total
Cost of iced: 5 x 80 = $400.00
Cost of plain: 4.5 x 30 = $135.00
$535.00 total
Earned for iced: 7 x 80 = $560.00
Earned for plain: 6 x 30 = $180.00
$740.00 total
Profit: $740 - $535 = $205.00
Going through the same process with 60 dozen plain and 60 dozen
iced will give them a profit of $210.00.
Another valid question may be how to write these constraints
as inequalities and what each of their graphs may look like:
Let p = # of dozen of plain cookies (x-axis) and
i = # of dozen of iced cookies (y-axis)
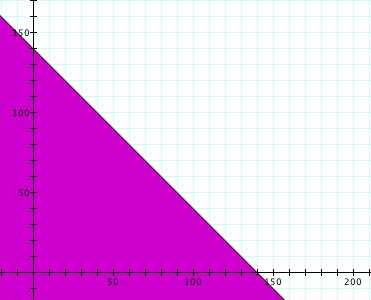
Constraint 1 : oven space -- 140 dozen, so p +
i < 140
Constraint 2 : time -- 15 hrs. = 900 minutes
t(p) = time to make plain = .1p
t(i) = time to make iced = .15i
so, .1p + .15i < 15
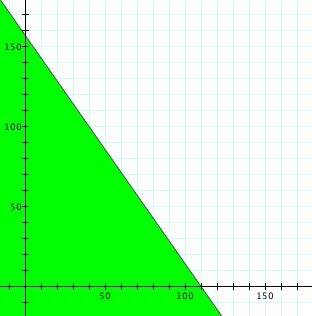
Constraint 3 : dough -- 110 Lbs
amount of dough to make 1 dozen plain = 1p
amount of dough to make 1 dozen iced = .7i
so, p + .7i < 110
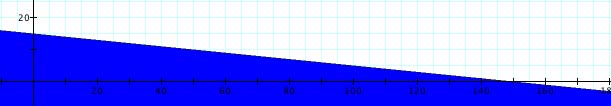
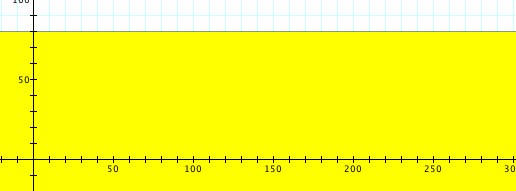
Constraint 4 : icing -- 32 Lbs
amount of icing per dozen cookies = .4i
so, .4i + 0p = .4i < 32
We can express profit as: Profit = 1.5p + 2i
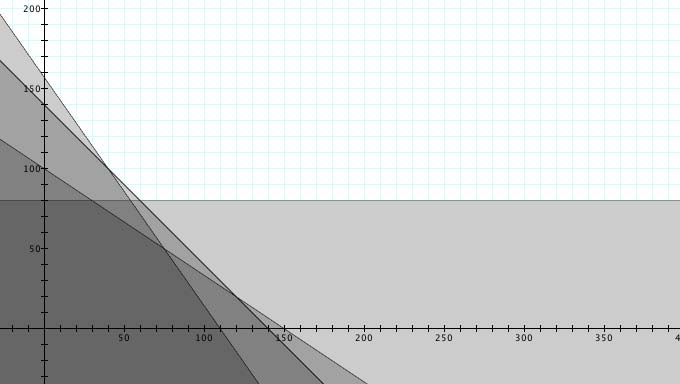
After seeing each of our constraints graphed separately,
it is logical to wonder what these graphs may look like graphed on the
same set of axes:
The area covered by all of the graphs is called the feasible region.
Back to title page
Explore further