ELLIPSES
BY
SHADRECK S
CHITSONGA
What is an ellipse?
Most students are familiar with the shape shown in
figure 1. Yes, it is that of an ellipse. It is very common to see an ellipse
defined algebraically by using the general equation ![]() , where a and b are some positive constants. For example in figure 1,
the equation for the ellipse is
, where a and b are some positive constants. For example in figure 1,
the equation for the ellipse is ![]()
Do you know the values of a and b ?
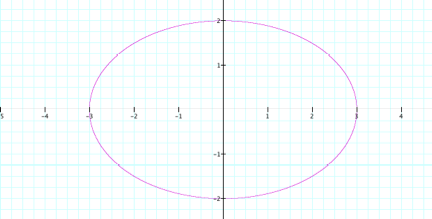
Figure 1
But can we define an ellipse differently? The answer
is yes. Figure two was generated in GSP by using locus. This time we did not
use the equation that we used for figure 1. We still ended up with an ellipse
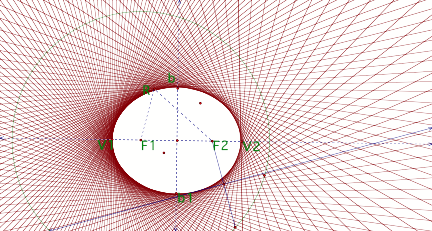
Figure 2
How do we define an ellipse using the geometry? Before
we do that let us look at a few things from figure 2.
v
V1 and V2 are called the
vertices of the ellipse.
v
The distance from V1 to
V2 is called the major axis.
v
The distance from b to
b1 is called the minor axis.
v
F1 and F2 are the foci
of the ellipse.
Definition: An ellipse is the
set of points in a plane whose distance from
two fixed points in the plane have a constant sum.
The two fixed points referred to in the
definition are the two foci. If we consider R as one of the points in the plane
then the definition is saying that for any point like R, the sum F1R +F2R =
Constant
Now let us switch our attention to
functions of the form ![]() . In this case k is a positive integer and e is called the eccentricity and its value is less than 1. We
have explored already situations where e is greater than 1 and also when e is 1. Go to these links e = 1 and
e is greater than1
. In this case k is a positive integer and e is called the eccentricity and its value is less than 1. We
have explored already situations where e is greater than 1 and also when e is 1. Go to these links e = 1 and
e is greater than1
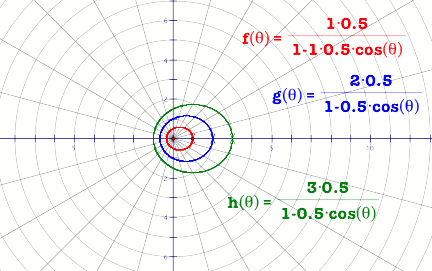
Figure 3.
Figure 3 shows curves for the functions of the form ![]() . Different values of k have been
used. There are a few things we can take note of:
. Different values of k have been
used. There are a few things we can take note of:
v
The curves are all
ellipses.
v
The major axis is in the
x-axis and the minor in the y-axis.
v
The curve with the
largest value of k is the largest and that with the smallest value of k is also
the smallest.
v
Keeping everything else
constant apart from k, we see that for k=1, part of the curve cuts the x-axis
at (1,0), for k=2 at (2,0) and similarly for k=3, at (3,0).
In figure
3 all the functions have -.5 cos ![]() in the
denominator. What happens when that is replaced with +.5 cos
in the
denominator. What happens when that is replaced with +.5 cos ![]() . CLICK
HERE to explore.
. CLICK
HERE to explore.
What happens when cosine q is replaced by
sine q? Look at the curves below:
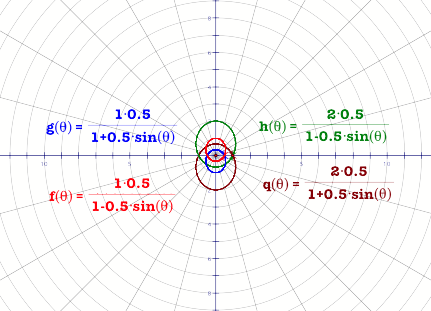
Figure 4
Compare the curves in figure 4 to those in figure 3.
What are some of the similarities and differences?
Now let us investigate what happens when we keep all
the other things constant but vary the value of e. In this case we are only
interested in the values of e between 0 and 1. What is happening to the ellipse
as the value of e approaches 1. In figure 5 we have only gone as far as e = .9.
Use this LINK to
open GSP to put in your own values of e between .9 and 1. Note the grid has just been removed for clarity.
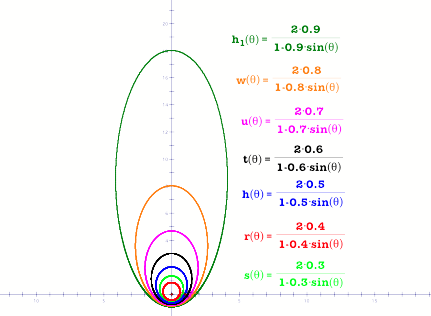
Figure 5