
ASSIGNMENT 11
BY
SHADRECK CHITSONGA
CONICS-USING
POLAR EQUATIONS
Before going through this write up, please open this LINK to have an idea of what we will be discussing. We
will start here by looking at the parabola.
![]()
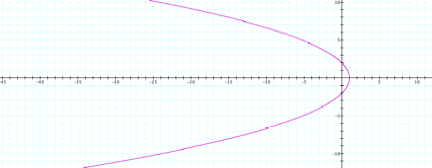
Figure 1
This is a parabola whose axis of symmetry is in the
x-axis. It opens up towards the negative x-axis. This is so because the
coefficient of y![]() is negative.
Its vertex is at (1,0) and crosses the y-axis at (0,2) and (0,-2).
is negative.
Its vertex is at (1,0) and crosses the y-axis at (0,2) and (0,-2).
Here is another graph. Is this a parabola as
well? How do you know?
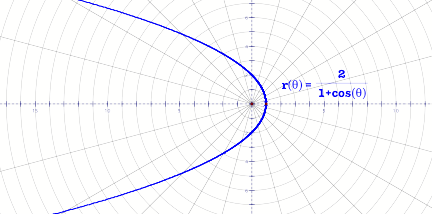
Figure 2
One thing that might be obvious is that the two curves
in figure 1 and figure 2 look alike, but the functions used to draw them do not
look the same. The first curve is
drawn in the rectangular coordinate system, while the second curve is drawn in
polar coordinates.
In this write up we will investigate why this is the
case.
We will start by looking at the construction of a
parabola in GSP. There are a number of points we want to highlight.
The diagram in figure 3 shows the construction of a
parabola in GSP. This construction uses the locus definition of a parabola.
A parabola is defined as the set points in
the plane equidistant from a given line called directrix and a point P not on
the line.
Fo is called the focus of the parabola.
Using this definition it is obvious why
PFo = PQ.
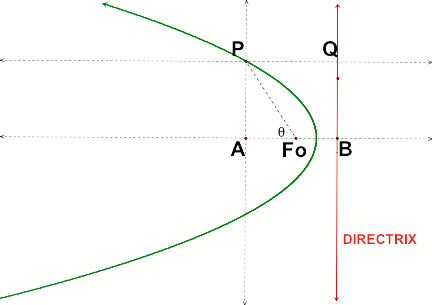
Figure 3
We will use this diagram to try to manipulate a few
things.
By construction we know that PQ = AB.
Now let the distance PFo be r and FoB be k. We can write PQ = AFo +FoB
Now let us express PFo in terms of angle ![]()
PFo =
![]()
Letting PFo be r , we can now write AFo = r cos ![]() . This means that we can write PQ = k + r cos
. This means that we can write PQ = k + r cos ![]() (i)
(i)
We will now introduce the terminology used in conics.
The ratio ![]() is
called the eccentricity of the curve.
Lower case “e” is used to
represent the eccentricity.
is
called the eccentricity of the curve.
Lower case “e” is used to
represent the eccentricity.
Now using (i) and knowing that we let PFo be r, we can
write
![]() =
= ![]()
This means that
![]() = e,
= e,
Equivalently ![]() (ii)
(ii)
Now let us go back to the curve that we drew in polar
coordinates. The equation for the curve is ![]() (iii).
(iii).
Are there any similarities between (ii) and (iii)?
What about if write (iii) as ![]() .
.
Now we can see that the two equations are identical; k
= 2 and e = 1.
Remember e
is the eccentricity. But we know from the definition of the parabola that PQ =
PFo, and that ![]() = e. this then
means that
= e. this then
means that ![]() = e =1
= e =1
Now that we have established that the function ![]() or more generally
or more generally
![]() gives a curve
that is a parabola.
gives a curve
that is a parabola.
There are still a few things we can
explore here. For example we can do the following:
1. What effect does changing the value of k
have on the curve?
2. What happens when we introduce a negative
in the denominator instead of
a positive sign? I.e. use ( 1- e cosq)
To
answer these questions, let us look at the curves in figure 4
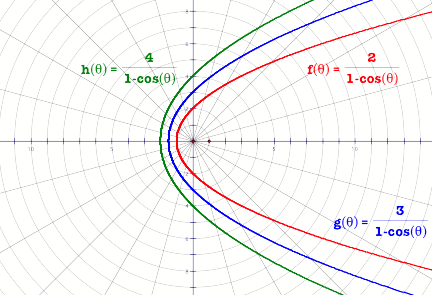
Figure 4
What observations have you made? Did you
notice the following?
1. Putting a negative sign in the
denominator, changes the orientations of the
parabola. It is now opening towards the positive
x-axis.
2. As the value of k increases the
parabolas get wider.
3. The value of k determines where the
parabola cuts the y-axis. The curve
crosses the y-axis at (0,-k) and (0, k).
4. In our example here all the curves share
the same line of symmetry.
One question that one might have is; Is it possible to have parabolas that have their axis of
symmetry as the y-axis? With
the function that includes the cosine of an angle we have seen that the
parabolas formed have their lines of symmetry in the x-axis. Now let us try the
functions that have sine of an angle. Refer to figure 5.
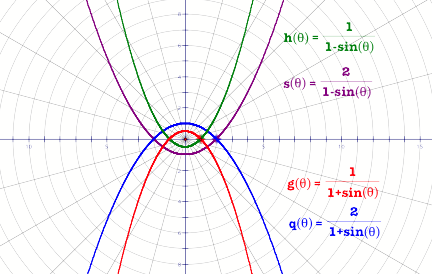
Figure 5
Just as we did with the curves involving the cosine we
can also talk about a few things here.
1. Leaving all the things the same changing
from a cosine to a sine
gives a parabola whose axis of symmetry is
now the y-axis.
2. If there is –sin q in the
denominator the curve is concave upwards, while
if it is
+sin q, the curve is concave downwards.
3. Just as before the value of k determines
where the graph crosses one of
the axes. In this case the graph crosses the
x-axis at (-k, 0) and (k , 0).
For
hyperbolas go to this LINK. For ellipses go
to this LINK