Polar Equations
by Hwa Young Lee
In this assignment, we are going to investigate polar equations and the cosine graph.
First, let's start with polar coordinates. The coordinate plane that we used in the other assignments was the cartesian coordicante plane.
(In assignment 10, there is a short story of how Descartes first invented this idea of the plane, do you remember?)
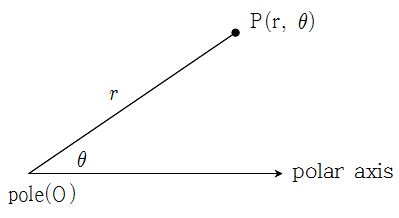
Here, points are represented as (x, y) in the rectangular cartesian coordinate system, but there is a different coordinate system, called the polar coordinate system, that can be used as well.
Here, points are represented in terms of their distance r from a fixed point called the pole (or the origin) and the angle
between the polar axis and the ray passing through the point from the pole.
Here, points are represented as
.
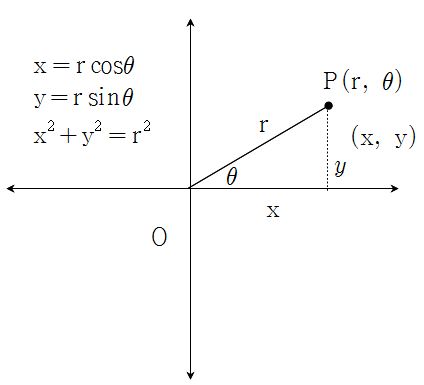
We can locate the polar axis to the x-axis and the pole on the origin of the cartesian coordinate plane. Then the polar coordinates
In terms of the polar coordinate system, the idea of symmetry can be different from the cartesian coordinate system. Let f(r,
a) If f(r, -
b) If f(-r,
c) If f(r,
-
.
Within the polar coordinate system, let's find out what the graph of
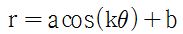
looks like when a, b, and k varies.
1) The effect of a
Let b=0, k=1 then
.
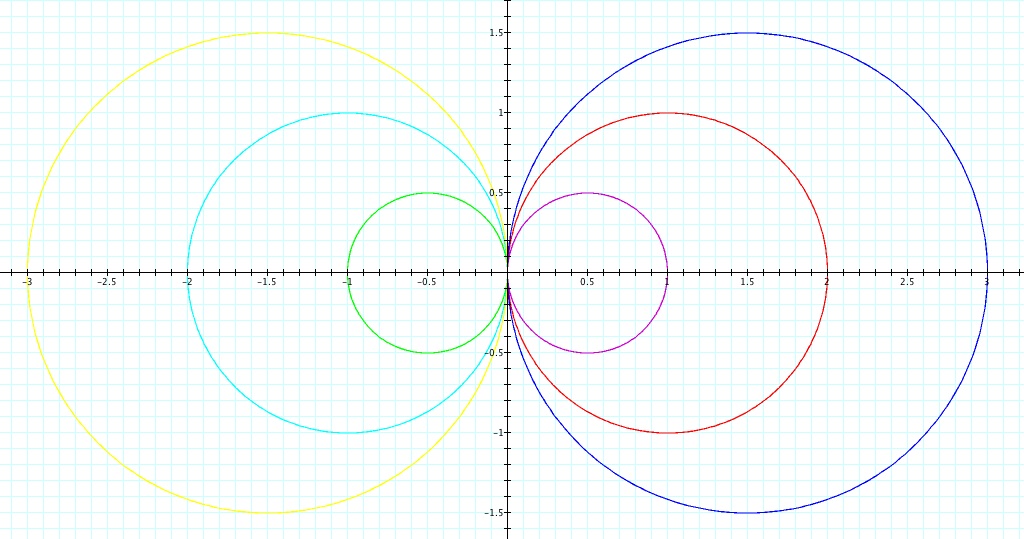
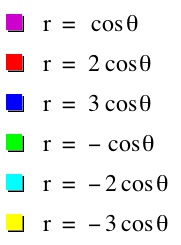
Let's take a look at a few graphs for different values of a.
We can see that the polar equation forms a circle.
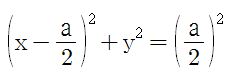
We can check this algebraically by converting the coordinates to the cartesian coordinates.
Since
So we get
Also, since
, we get
. What does this equation give us?
A circle with center
and radius
!
So, when b=0, k=1, the polar curve is a circle and a affects the center and radius of the circle.
The cosine graph is symmetric about the origin. In other words, it is an even function with
.
Thus we have the same result for when k=-1. Then what graphs do we have for when k is not equal to 1 or -1?
Before we proceed, we review what we have found in assignment 1.
From our investigation, we found out that in
, |a| affects the range and d results in a vertical shift. Thus, the constants a and d determine the range and the range is
.
Also, we found out that |b| affects the period and
results in a horizontal shift. Thus, the constants b determines the period. Like we found in our investigation, the period is
.
Notice that
, and thus the cosine graph is a horizontal transformation of the sine graph.
Hence it has the same affects for the parameters in the equation. We are going to use this fact throughout this assignment.
2) The effect of k
Let a=1, b=0 then
.
Earlier we found that
.
So, the graph is symmetric about the polar axis and we are interested in |k|.
Let's take a look for a few graphs for k>0.
You can notice that we no longer have a circle. Actually, the graph is called a rose. If there are n number of leaves, we call it a n-leaf rose.
Let's find out how many leaves of the rose are formed for a few examples.
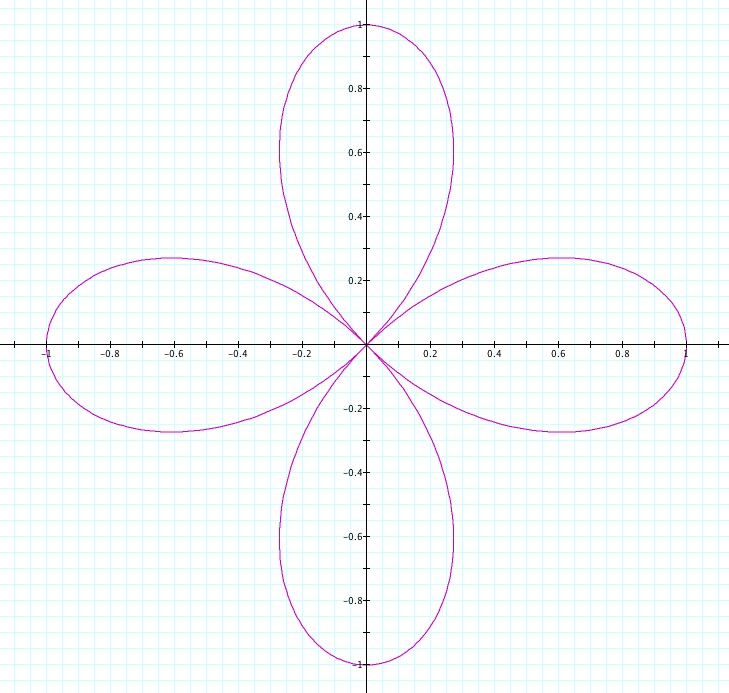
a) Let's investigate
.
Instead of directly converting into cartesian coordinates, we approach slightly differently.
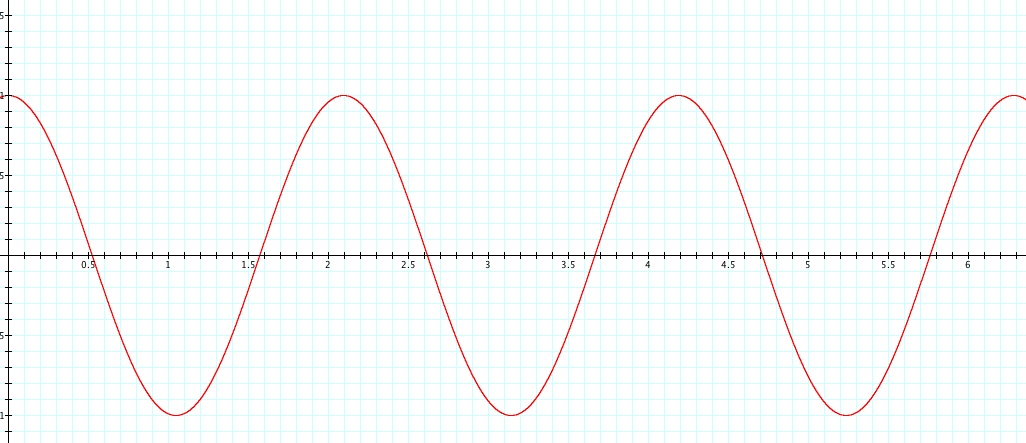
To observe how r is changing, let's first watch the graph in the cartesian coordinate plane for
.
Notice that the period is
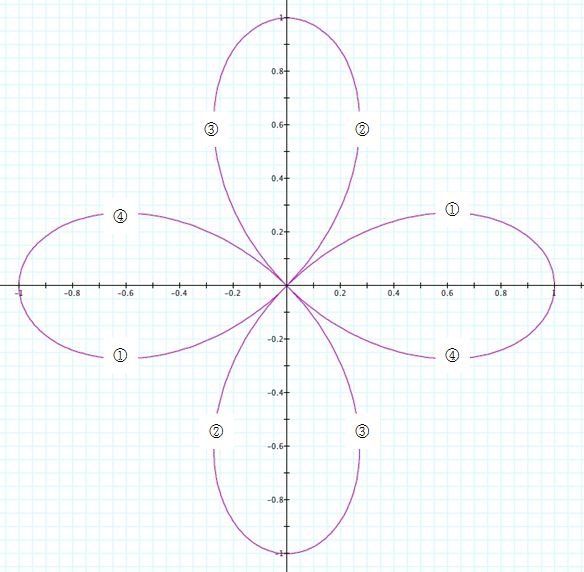
Now let's take a look at the change in r and plot this change in the polar plane.
For
, r decreases from 1 to 0, which results in
in the graph.
For
, r decreases from 0 to -1, which results in
in the graph.
For
, r increases from -1 to 0, which results in
in the graph.
For
, r increases from 0 to 1, which results in
in the graph.
Notice that each second interval in each case are a rotation of
Also, note that
so our graph is symmetric about
This is how we get a four-leaf rose!
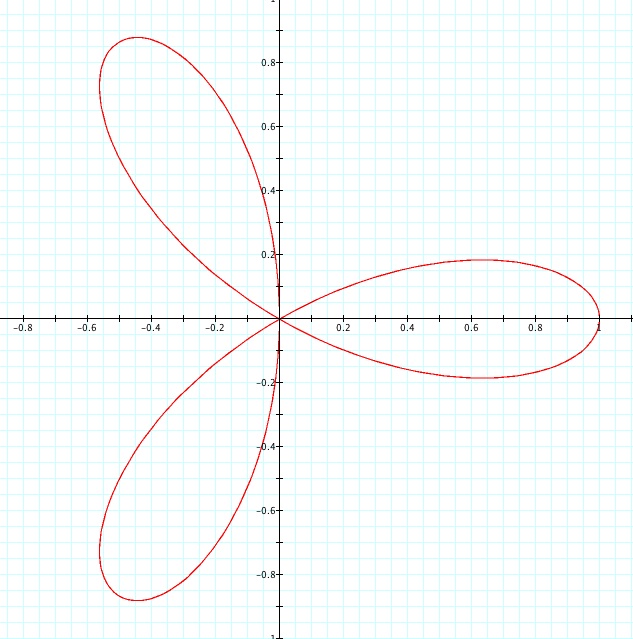
b) Let's investigate
.
Again, to observe how r is changing, let's first watch the graph in the cartesian coordinate plane for
Notice that the period is
and there are three cycles in the graph.
So, every
Using symmetry and the idea we used in the previous example,
we can see that in this case we have a 3-leaf rose.
This is because the graph for different intervals overlaped.
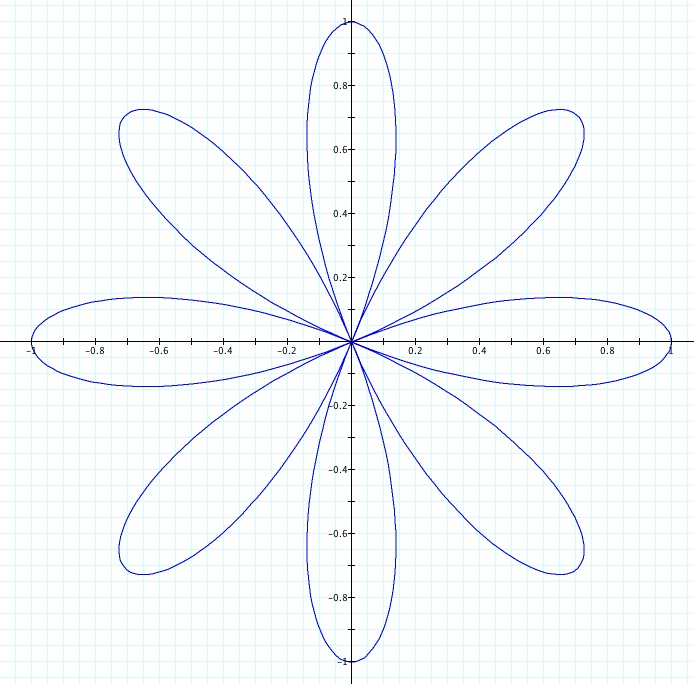
In general, when |k| is even, we have a 2|k|-leaf rose; when |k| is odd, we have a |k|-leaf rose.
3) The effect of b
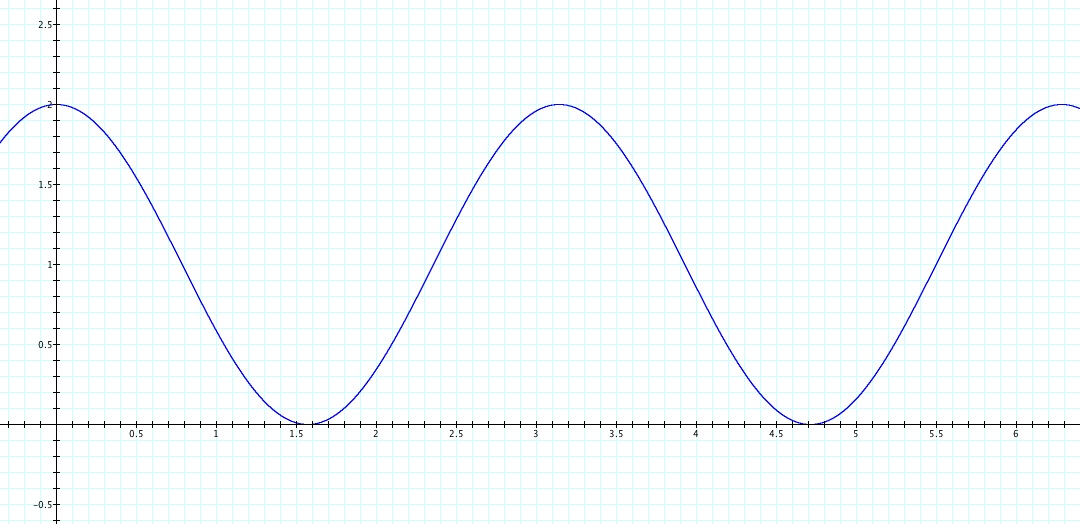
Let a=1 and to extend from our earlier example, we use k=2. Let b=1 then we have
.
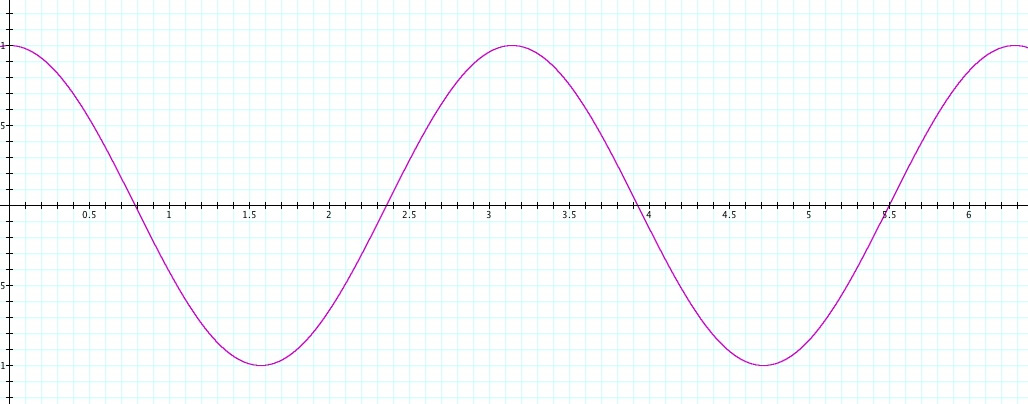
Again, to observe how r is changing, let's first watch the graph in the cartesian coordinate plane for
Notice that the period is
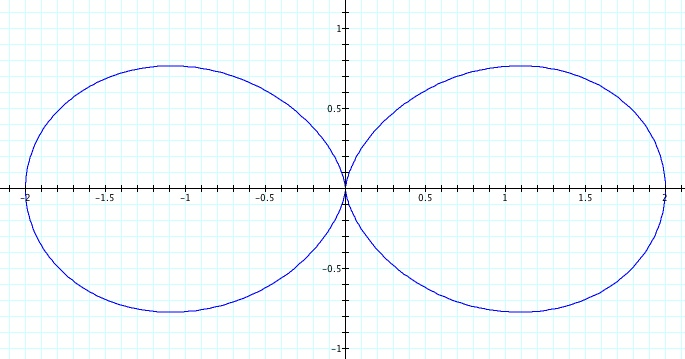
Try graphing the graph on the polar coordinate plane by examining the change of r.
Can you guess the graph?
graph of
Does the graph make sense to you?
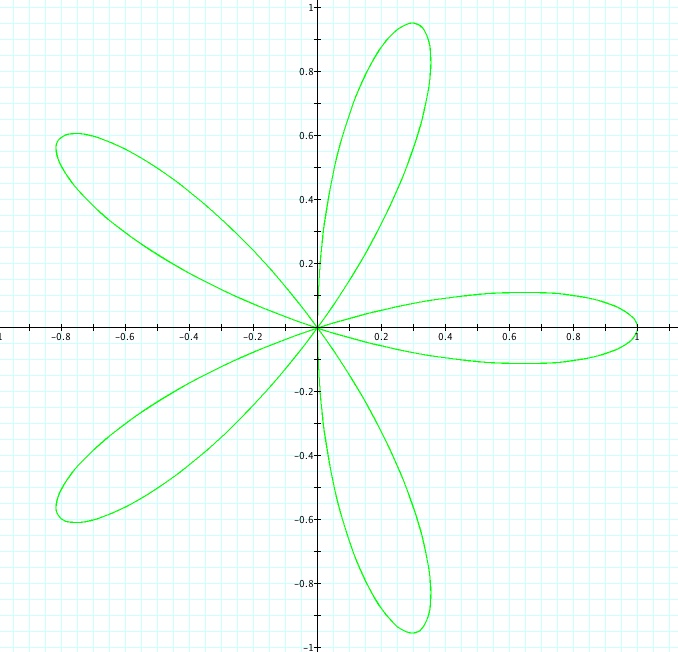
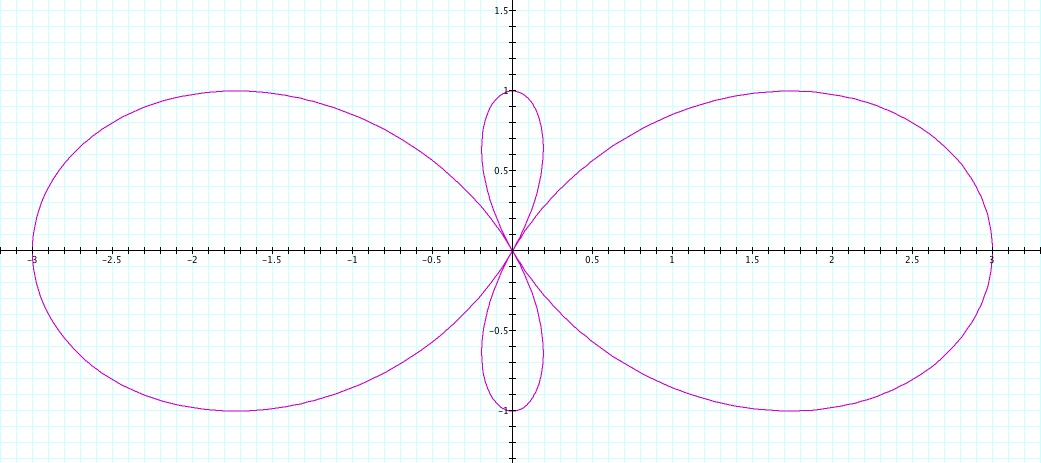
Try another example. Let a=1, k=3, b=3 so
.
graph of
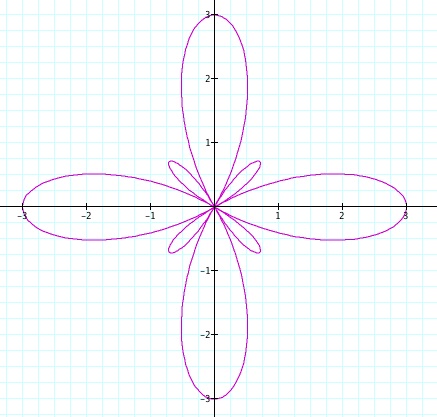
What effect would a have in
?
|a| amplifies the length of r while b shifts the values of r vertically. Let's put this all together.
Let. Can you guess the graph?
Does the graph make sense to you?