
All modern graphing calculators have the capability of plotting data, but the difficulty of exporting or printing the results for presentation is a drawback. Most mathematics students have computer access either at home, at school, or their local library and most of these computers have spreadsheet software. This write-up describes an experiment and its presentation using a spreadsheet, in this case Microsoft Excel.
The experiment:
Equal amounts of boiling water were poured into two containers, one an insulated travel mug with lid and one a drinking glass. Meat thermometers were placed in each container and temperature readings were recorded each minute for 60 minutes. Then I got tired and checked the temperature every 10 minutes or so for a while. Throughout the experiment, the ambient temperature (temperature of the room) was kept at a near constant 74 degrees Fahrenheit. The data were entered into a Microsoft Excel worksheet. If you have Excel software on your computer and would like to see the raw data, click here.
Excel will easily chart the data in many forms. Here is a chart
showing the data in a format Excel calls simply "scatter".
The chart was saved in Excel, then exported to Microsoft Paint
and saved as a GIF file before being pasted into Netscape Composer.
The chart is also linked to the raw data file so that clicking
anywhere on the chart will open Excel and display the data (if
you have Excel on your computer.)
A student's analysis of the graph might lead to statements such as "the water in the glass cooled much faster than the water in the insulated mug at first, but then they cooled at pretty much the same rate", or " the water in the insulated mug cooled at a constant rate and the water in the glass didn't", or even "there wasn't as much water in the glass at the end as there was at the beginning". All of these could lead to interesting discussions.
Looking at the graph of the data for the water in the glass (shown in pink above), a student in Algebra II or above (hopefully) would suspect exponential decay and make the following deductions.
It is easy to have Excel use this formula to predict the temperature T at any given time t. The results are shown below. Click anywhere on the chart if you want to see the Excel spreadsheet with the temperature predictions.
As you can see, the exponential equation
![]()
is not a great predictor of the temperature (except at times t=0
and t=60) . What's the deal? One glaring problem with the prediction
is that the temperature of the water in the glass is predicted
to drop below the temperature of the room (74 degrees).
That seems unlikely doesn't it? How can we get the 74 degrees
into our prediction?
A little thought might lead us to decide that the horizontal asymptote of the graph must be T = 74 and realize that we need an exponential graph of the form
Inserting known values from the data lead us to appropriate values of C and k and the equation
The chart below shows the predicted temperature based on this new equation.
As you can see, the exponential equation above is a much better
predictor of the temperature than our first attempt. Can we do
better?
Historically, temperature has been a major study in physics. We have at our disposal. Newton's Law of Cooling, which states that the rate of cooling of an object is proportional to the difference between its current temperature and the temperature of its surroundings. In symbols,
where T-omega is the ambient temperature.
The value of k depends on many variables, including the shape and composition of the object or its container and whether the liquid is stirred or still. This value is found experimentally. Fortunately for us, I jsut did an experiment and will attempt to find a good value for k.
Using Excel, it is easy to calculate a value for k at any particular time since I gathered data on the current temperature T, I know how much the temperature changed over the just-elapsed time period, and I know the ambient temperature T-omega. The value of k is not the same for each time period as you can see in the spreadsheet. Errors in the reading of the thermometer are the most likely cause of this. I averaged the non-zero values of k for use in predicting the temperature of the water. The chart below shows the actual temperature of the water in the glass, the prediction based on Newton's Law in its differential form, and the predicton based on the solution of the differential equation, which is
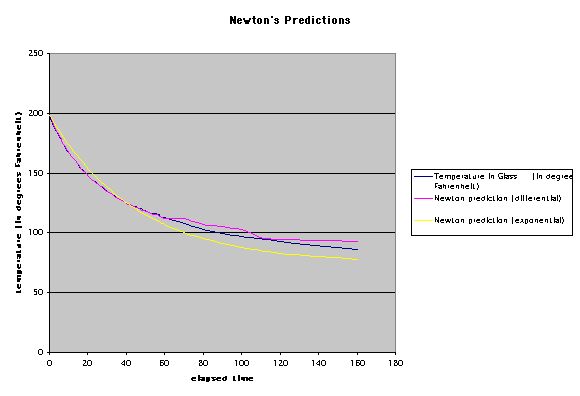
As you would expect, the differential predictions are extremely
close to the actual temperatures, since the differential form
of Newton's Law of Cooling was used to calculate one minute "steps"
based on the current difference in temperature between the water
and the room. The exponential form (solution to the differential
equation dT/dt = k(T - T alpha) "averages" the
change out over the entire time period. Neither method displays
much accuracy after about 60 minutes. This isn't surprising since
after that time, readings were taken over much longer time intervals,
and also the change in temperature over each time period became
smaller and more difficult to record accurately without more sophisticated
thermometers.
Design other experiments where the spreadsheet is an appropriate
tool for analysis and presentation of results. Some suggestions
are:
Long-term analysis of sunrise and sunset times or daily temperatures
Long-term measurements of water height in a local river or of
water quality (turbidity, dissolved oxygen, dissolved impurities,
etc.)
Daily attendance at your school (my study conducted over an entire
school year, showed a clear sinusoidal pattern, with lower attendance
on Mondays and Fridays)