Now that we are able to use either the TI-83 or Graphing Calculator program to graph one line on a coordinate plane, we will now graph more than one line at a time and find their point of intersection. This point is the one value that will make both equations the same value at the same time. If you cannot remember how to graph a line using the technology refer to assignment 8.
Technology is a tremendous asset when solving systems of equations graphically. It is two time consuming and in-exact to try and solve systems graphing by hand. Technology however, has changed what had become an obsolete method of systems of equations into a viable and useful method of solving equations.
In this assignment, we will take the skills we learned in assignment 8 and extend them. It is really quite simple and quick.
For the TI-83, all we have to do is use our six step template twice. We first push the Y= button to bring up our screen to enter the equation of the line. So, next to the first Y=, we enter the equation of our first line. Then, instead of pushing the graph button, we push the down arrow. This should take s to the line directly below the one that we were working upon. Now, our cursor should be blinking next to another Y=. So, all we have to do is enter the equation of our next line. After we have done this, we now push the graph button. Again the screen will change but instead of seeing the graph of one line, we will see the graph of two lines. We now place our cursor on one of the lines and move it until we are at the point of intersection. Now, look at the bottom of the screen. The TI gives us the coordinates of the point! We don't have to do any work and we have our answer.
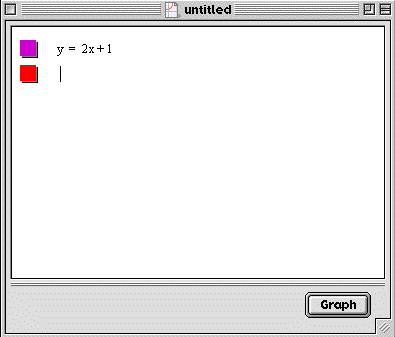
We already learned how to graph one line using the graphing calculator in Assignment 8. The only difference now is that we will want to graph two lines at a time instead of one line. This is easily accomplished. We start the same way by entering the equation of a line next to the first purple box. Now, instead of hitting the graph button, we want to be able to enter the equation of the second line. To do this, we click on Math and then New Math Expression. This will bring up a box of a different color directly below the purple box. This will look like:
Now, we type in the equation of the second line and hit graph. The finished product will look like:
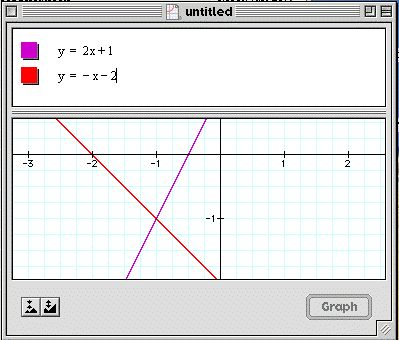
It is now very easy to see the point of intersection. This point appears to be at (-1,-1), but our eyes could deceive us. We want to know the exact coordinates of the point of intersection. In order to find this out. Take the cursor and click on the point. Graphing calculator will then display the coordinates of the point.
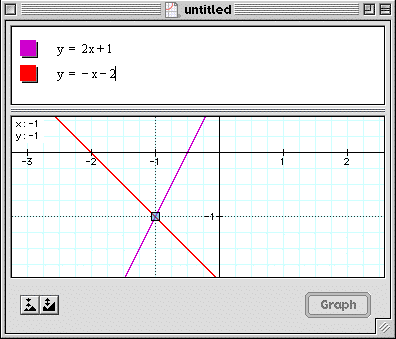
The coordinates appear in the upper left hand corner of the graph and are indeed (-1,-1). This should now allow you to do the assignments.
Click on the links below for your assignments.