Objectives:
1) To learn how to solve a linear equation graphically
2) To use the graphing calculator to aid in the learning of how to solve a linear equation graphically
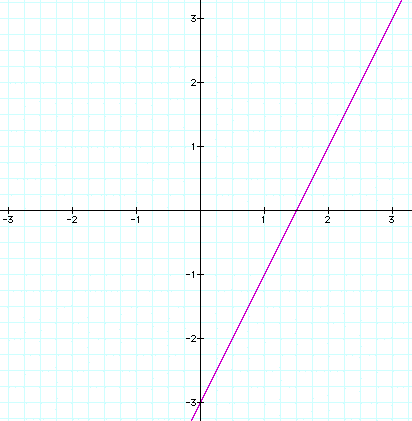
1) The best way to explain this process is to do so while working an example. Remember, the end goal is to have an equation is slope intercept form so that a graph can be drawn and the solution found. Suppose we had the equation 2x + 3 = 6. The first thing that you do is subtract 6 from both sides of the equation. You do this to get a zero on one side. Now we have 2x - 3 = 0. Now the next step is to substitue y in for the zero. Essentially what you are saying is that y equals 0 and they can be substituted for one another. When you do this, you will now have 2x - 3 = y or if you like having the y on the other side you can say that y = 2x - 3. These two equations are the same. Now, using what we learned yesterday, graph this equation. The y-intercept is -3 and the slope is 2. Either using pencil and graph paper or some technology, whether it be the graphing calculator or some graphing software on the computer, graph this line. I will once again use the software Graphing Calculator 3.2. The graph should look like the one below.
Now that we have the graph the solution to the problem is easy, or is it? The graph shows every possible x,y values that make the statement true. So which one do we pick? There are infinitely many possibilities, so which one is it? Well, we have to go back to a previous step. See we have already set what our y-value must be. Remember when we substituted y for 0? When we did that, we set y equal to zero, something that we also said before. Now, we have part of our ordered pair that is the solution for the problem 2x + 3 = 6, and that is that y is equal to 0. Recall from a previous lesson, what is the point called where y is equal to 0? It is the x-intercept. So if we can find the x-intercept, we have our answer. It appears that the x-intercept, where the line crosses the x-axis, in the graph above, is 1.5. So is that our answer? Well, let's check this answer in the equation from the beginning, 2x + 3 = 6. Substitute 1.5 for x and you get the following:
We see from this that the answer, x = 1.5, is the solution to the problem.
If this is not clear, here is the basics:
1) First, the equation that you will be given will not have a y variable in it at the beginning.
2) Write the equation so that a 0 stands alone on one side of the equation.
3) Substitute y in for 0. Now you have the equation in slope-intercept form and we can graph this. Also, by doing this, you have set the value of y equal to 0.
4) Now graph the equation.
5) Because we set y equal to 0, then we now find the x-intercept, where the line crosses the x-axis, and this will be the solution to the problem.
6) Finally, check your solution in the original equation given and see if your solution is correct.
Teachers, give your students several examples and possibly go further into the discussion of why the x-intercept is the solution to this equation.
2) The graphing calculator would be a great tool to use here. Let's be honest, most things that we will ever encounter in any real life situation will not come out to some nice integer or even fraction answer like the problem above did or like the examples the students will see in the textbook exercises. Therefore, teaching them how to use the graphing calculator to estimate the solutions would be a very empowering tool. The way to use the graphing calculator is to graph the equation and then use the trace function to estimate the value of the x-intercept. An example of an equation 1.8(3x-5) + 10.25 - 7.3x = x - 2. This would be a mess to try to solve and graph by hand but for using the calculator, all that would be necessary is to move the x-2 to the other side and then plug the numbers into the calculator. After doing this, you're solution should be around 1.11. Give your students some of these examples and let them see the power of the graphing calculator.
Return to Instructional Unit overview