
Ken
Montgomery
EMAT 6690
MATHEMATICS
APPLIED IN INDUSTRY
Linear
Programming
Problem Statement
Linear Programming is an application of mathematics used extensively in Engineering, Business and Economics. Linear Programming in its most basic application requires the graphing of systems of inequalities. Prerequisite to this skill is a basic understanding of how to graph lines.
Graphing a Line
Most students in algebra have practiced solving and graphing linear equations. The standard form of a linear equation is given in Equation 1, where a and b are coefficients of x and y respectively and c is a constant value.
![]()
Equation 1
Often, however we are interested in the relationship that one variable has on the other. For instance, the number of porpoises killed could depend upon the number of registered tuna fishing boats. As tuna fishing boat registration increases, we might expect an increase in the number of incidents, which could result in an increase in the number of porpoises killed by such motorboats. We say that porpoise deaths are dependent upon motorboat registration. However, we would not expect the number of registered motorboats to depend on the number of porpoises killed. In other words, motorboat registration is independent of porpoise deaths. Porpoise deaths would be the dependent variable and registered motorboats would be the independent variable. One might wish to know how many additional porpoise deaths
Traditionally, with the use of x and y in the general form of these equations, y is the dependent variable and x is the independent variable. In other words, y is dependent on x and x is independent of y.
Equation 3 expresses a specific linear relationship between x and y, in which the slope is 3 and the y-intercept is –7.
![]()
Equation 3
The graph of this equation is shown in Figure 1, which clearly shows the –7 y-intercept and the increase of y by three, for each one-unit increase in x.
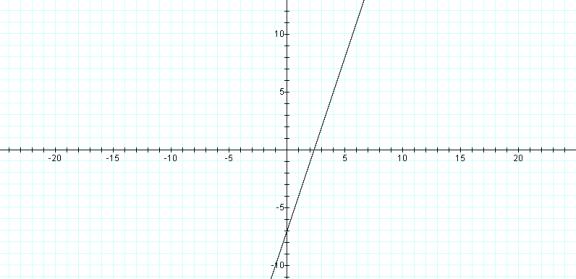
Figure 1
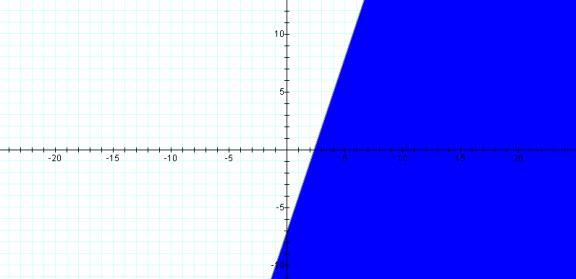
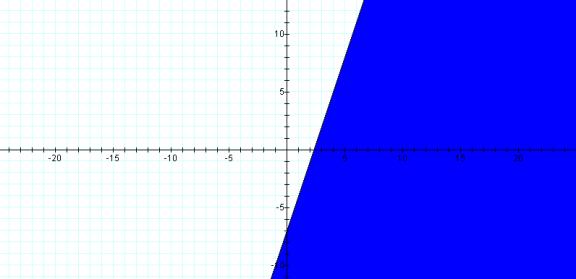
Graphing an inequality
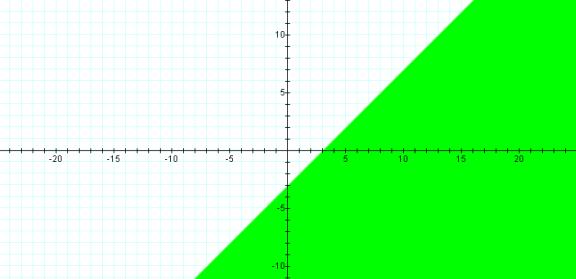
Given an inequality such as the one presented in Equation 4, one may graph the inequality by first graphing the line of Equation 5
![]()
![]()
![]()
![]()
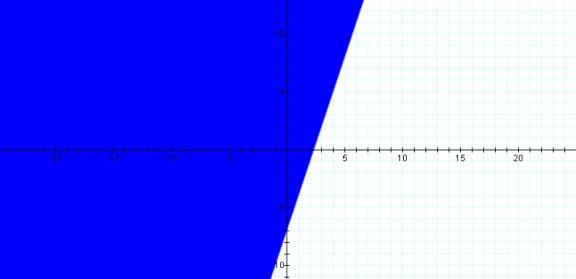
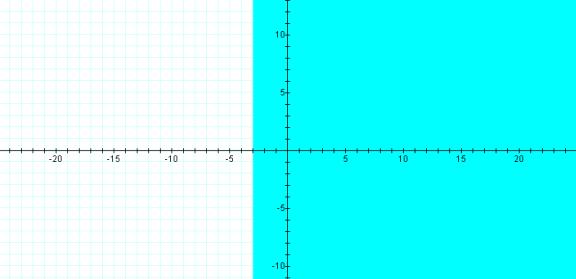
Graphing a system of Inequalities
![]()
![]()
The composite of these two inequalities is thus
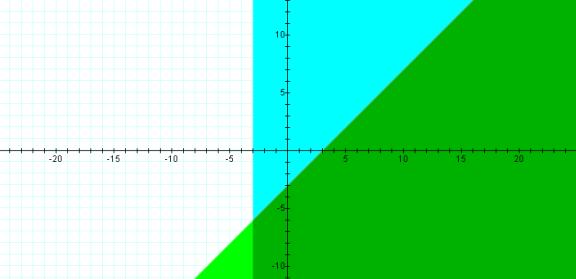
![]()
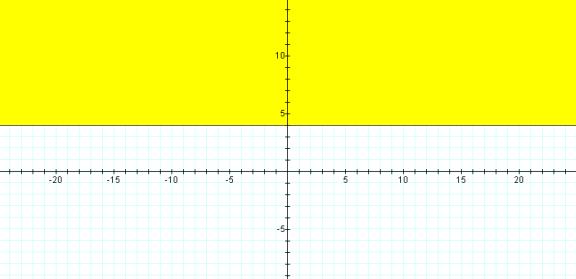
The composite of all three is thus
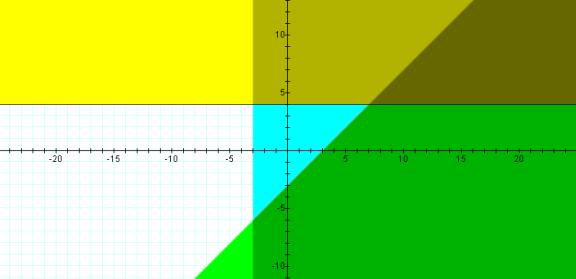
A valid solution to this system of inequalities would thus consist of the ordered pair of a point lying inside the bounded region of the light blue triangle or on the line y = 4 (the bottom boundary of the region) to the right of the point (7, 4).
You can download the Graphing Calculator file LinearProgEx.gcf and see how changing the constraints affects the restraint polygon.
An important application of Linear Programming is
a process
called optimization, which is used extensively in business and
economics.
Return to EMAT 6690