
Let us consider equations of the form
![]()
What happens when we change d?
Example 1
Let's let e = 0 and change d.

As you can see, in the first equation, d = 0.
In the second equation, d = 2.
In the third equation, d = 4.
In the fourth equation, d = - 2.
In the fifth equation, d = - 4.
What do the graphs look like?

As you can see, each graph has the same shape as the graph of
![]()
but the graphs are shifted horizontally.
For example, when d = 2, the graph moves two units in the positive x-direction (to the right).
When d = 4, the graph moves four units to the right.
When d = - 2, the graph moves two units in the negative x-direction (to the left).
When d = - 4, the graph moves four units to the left.
Example 2
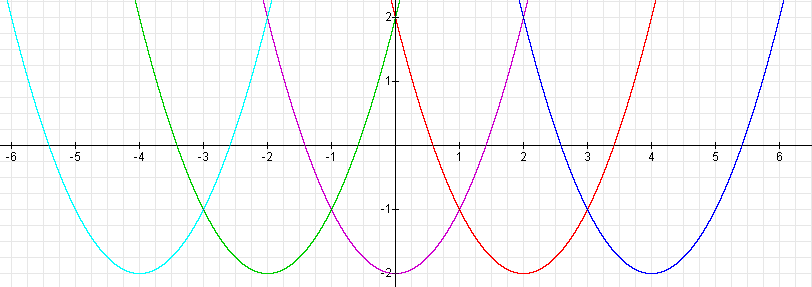
Let's let e = - 2 and change d.

As before, in the first equation, d = 0.
In the second equation, d = 2.
In the third equation, d = 4.
In the fourth equation, d = - 2.
In the fifth equation, d = - 4.
What do the graphs look like?

As before, each graph has the same shape as the graph of
![]()
but the graphs are shifted horizontally.
For example, when d = 2, the graph moves two units in the positive x-direction (to the right).
When d = 4, the graph moves four units to the right.
When d = - 2, the graph moves two units in the negative x-direction (to the left).
When d = - 4, the graph moves four units to the left.
Conclusion -- Changing d
In conclusion, changing d in the equation
![]()
results in a horizontal shift of the graph of
![]()
d units in the x-direction. If d is positive, the shift is in the positive x-direction. If d is negative, the shift is in the negative x-direction.
What happens when we change e?
Example 3
Let's let d = 0 and change e.

As you can see, in the first equation, e = 0.
In the second equation, e = 2.
In the third equation, e = 4.
In the fourth equation, e = - 2.
In the fifth equation, e = - 4.
What do the graphs look like?

As you can see, each graph has the same shape as the graph of
![]()
or
![]()
but the graphs are shifted vertically.
For example, when e = 2, the graph moves two units in the positive y-direction (up).
When e = 4, the graph moves up four units.
When e = - 2, the graph moves two units in the negative y-direction (down).
When e = - 4, the graph moves down four units.
Example 4
Let's let d = 2 and change e. From above, we know that the graph of
![]()
will be shifted two units to the right of the graph of
![]()
Here are the equations that we will graph.

As before, in the first equation, e = 0.
In the second equation, e = 2.
In the third equation, e = 4.
In the fourth equation, e = - 2.
In the fifth equation, e = - 4.
What do the graphs look like?

As we predicted, each graph is shifted two units to the right of the graph of
![]()
but the graphs are shifted vertically.
As before, when e = 2, the graph moves two units in the positive y-direction (up).
When e = 4, the graph moves up four units.
When e = - 2, the graph moves two units in the negative y-direction (down).
When e = - 4, the graph moves down four units.
Conclusion -- Changing e
In conclusion, changing e in the equation
![]()
results in a vertical shift of the graph of
![]()
e units in the y-direction. If e is positive, the shift is in the positive y-direction. If e is negative, the shift is in the negative y-direction.
Predicting what graphs will look like
Given an equation of the form
![]()
we can now predict what the graph will look like.
Suppose we are given the equation
![]()
In this equation, d = 3 and e = 4. Therefore, we expect this graph to be the graph of
![]()
shifted three units in the positive x-direction and four units in the positive y-direction. In other words, it will be shifted up four units and right three units.
Let's check! Here is the graph:

We were right! The graph is shifted to the right three units and up four units.
Suppose we are given the equation
![]()
In this equation, d = -1 and e = -3. We expect this graph of this equation to be the graph of
![]()
shifted one unit in the negative x-direction and three units in the negative y-direction. In other words, it will be shifted down three units and left one unit.
Let's check! Here is the graph:

We were right again! The graph is shifted to the left one unit and down three units.
Conclusion
In conclusion, if we are given an equation of the form
![]()
we know that the graph have the same shape as the graph of
but it will be shifted d units in the x-direction, and e units in the y-direction.
If d is positive, the graph will be shifted to the right, and if d is negative the graph will be shifted to the left.
If e is positive, the graph will be shifted up, and if d is negative, the graph will be shifted down.