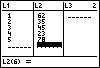
| Let's examine two variable statistics for a moment. If you desire
the "vital" statistical measures from two sets of data for comparisonpurposes
or any other reason, then start by placing some data into L1
and L2. |
 |
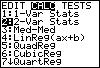
| Once you have entered tha data into the lists, pres STAT, then your
right arrow once, 2, and ENTER. |
 |
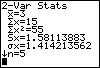
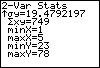
| If you used the same data set as I did, you should see the measures
for our data in L1. |
 |
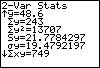
| Scrolling down, we find information about our data from L2,
as well as other useful calculations. |
 |
| That's it! Now let's work with the correlation and regression
features of the STAT-CALC menu. |
 |