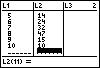
| Place the following data into list 1: 1, 2, 3, 4,
5, 6, 7, 8, 9, 10
Now place the following data into list 2: 25, 32, 56, 22, 14, 24, 32, 47, 15, 10. Your window should look like the following: |
 |
| Now use your 2nd button and your Y= button to retrieve the STATPLOT menu. Press ENTER , and choose the scatter plot option by using your arrow keys. Make sure that your Xlist and your Ylist are set as shown in the picture. | 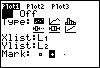 |
| Press your ZOOM button, and then your 9 button to get a graph of your data points. |  |
| You can use your TRACE button to move from point to point on your graph. That is all there is to creating a scatter plot . | 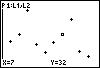 |