*This instructional unit is designed for hour and a half classes. If the material is being used for shorter classes then it may take ten or more days to cover all the material.*
Day 1: Graphs/Euler Paths and Circuits
Goal: Students will be able to identify vertices and edges on a graph. They will also be able to provide an algorithm for an Euler path or circuit for a given graph. They will be able to look at a graph and know if it will be possible to find an Euler path or circuit.
Vocabulary:
1. Graph- a collections of vertices and edges
2. Vertex - a point on a graph
3. Edge - a line or curve connecting vertices on a graph
4. Euler Path - a path which uses every edge of the graph exactly once
5. Euler Circuit - a path which uses every edge of the graph exactly once and ends at the vertex where it began
6. Degree of a vertex - the number of edges connected to that vertex
Click here for a GSP file to use while going through the examples for Day 1.
Example 1:
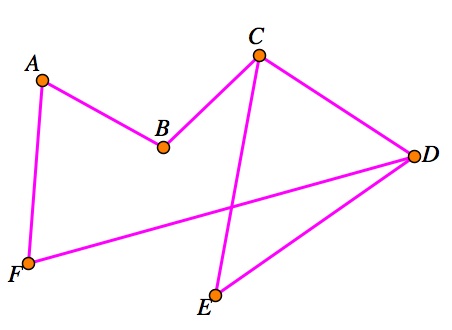
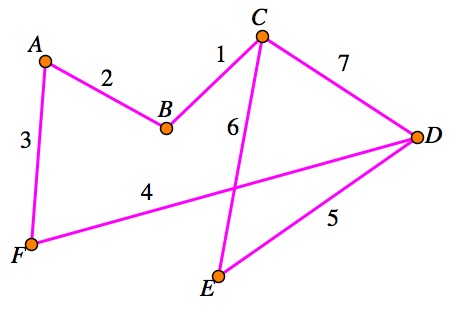
The graph above has 6 vertices (orange points) and 7 edges (pink lines). There are 2 vertices of degree 3 (C and D) and 4 vertices of degree 2 (A, B, E, and F).
Concepts:
1. In order for an Euler path to exist, there must be no more than two vertices of odd degree, and the path must start at a vertex of odd degree.
2. Euler Circuits can only be found in graphs with all vertices of an even degree.
Example 2:
The graph above shows an Euler path which starts at C and ends at D. The above graph has the edges labeled in the order in which they are used; however below is an algorithm for the Euler path:
CBAFDECD .
Example 3:
The graph above has five vertices of degree 2. Since all of the vertices have an even degree, we can find an Euler Circuit. One such circuit is provided by the algorithm below:
ACEBDA .
Student Work Period:
Students will need access to GSP for the following exercises.
1. Create a graph with 5 vertices and 7 edges. Label the vertices A, B, C, D, and E. Is this graph an Euler path? Is it an Euler Circuit?
2. Copy this page onto a new sheet. If your graph was not an Euler Circuit, add or subtract edges so that it is in Euler Circuit. (You may use the marker tool to make curved edges rather than lines.)
3. Repeat 1 and 2 with a new graph.
Click here for sample student work.
Homework:
Click here for the student worksheet. Click here for the key.
Day 2: Hamiltonian Paths and Circuits
Goal: Students will be able to decide if a graph is a Hamiltonian Path or Circuit by looking at the degree of the vertices.
Vocabulary:
1. Hamiltonian Path - a path which uses every vertex exactly once (*the vertex at which the path starts has not been used until the path reaches that vertex again after the start*)
2. Hamiltonian Circuit - a path which uses every vertex exactly once and ends at the vertex where it began
Concepts:
1. A Hamiltonian Path can only be found in a graph where all vertices are of degree 2 or 1 with no more than two vertices of degree 1. The path must also start at a vertex of degree 1 if there is such a vertex.
2. A Hamiltonian Circuit can only be found in a graph where all vertices have a degree of 2.
3. All Hamiltonians Paths are Euler Paths.
Click here for a GSP file to use while going through the examples for Day 2.
Example 1:
The graph above contains two vertices of degree 1 (A and E) and three vertices of degree 2 (B, C, and D). Thus, an algorithm for the Hamiltonian Path would be ABCDE.
Example 2:
The graph above contains all vertices of degree 2. This means that the graph is in fact a Hamiltonian Circuit. One algorithm for the Hamiltonian Circuit would be ACDBEA.
Proof of Concept #3.
If all Hamiltonian Paths have vertices of degree 2 or 1 with no more than two vertices of degree 1, then that means that all Hamiltonian Paths have vertices of even degree with no more than 2 odd vertices. This is in fact the definition of an Euler Path. Therefore, all Hamiltonian Paths are Euler Paths, yet all Euler Paths are not Hamiltonian Paths.
*(Teachers could use the comparison to all squares being rectangles yet all rectangles are not squares.)*
Student Work Period:
Students will need access to GSP for the following exercises.
1. Create a Hamiltonian Path using five vertices and at least four edges. Label the vertices A, B, C, D, and E.
2. Write an algorithm for the Hamiltonian Path.
3. Copy this page onto a new sheet. What is the maximum number of edges you could use in order to still have a Hamiltonian Path? Do you recognize anything about your graph with the maximum number of edges?
4. Repeat 1-3 using seven vertices and at least six edges.
5. What can you conclude about the relationship between the number of vertices and the number of edges for a Hamiltonian Path?
Click here for sample student work.
Homework:
Click here for the student worksheet. Click here for the key.
Day 3: Weighted Graphs
Goal: Students will be able to understand what the weights represent on a graph. They will be able to find the most efficient path for a graph.
Vocabulary:
Weighted Graph: a graph in which the edges are labeled with numbers representing time, distance, money, etc.
Most Efficient Path: a path whose sum of weights is minimal
Concept:
1. A most efficient path can be found by using the smallest numbers on the graph. However, this does not mean that it is always possible to do so. There will be some graphs with only one path between two vertices which has to be used.
Click here for a GSP file to use while going through the examples for Day 3.
Example 1:
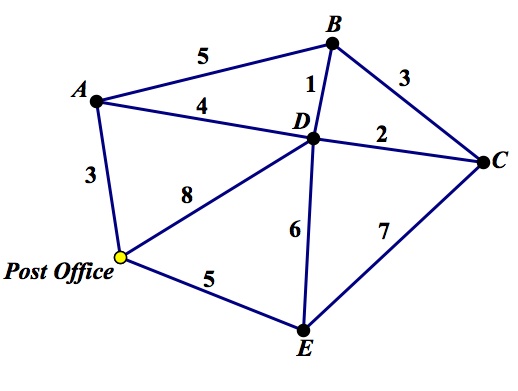
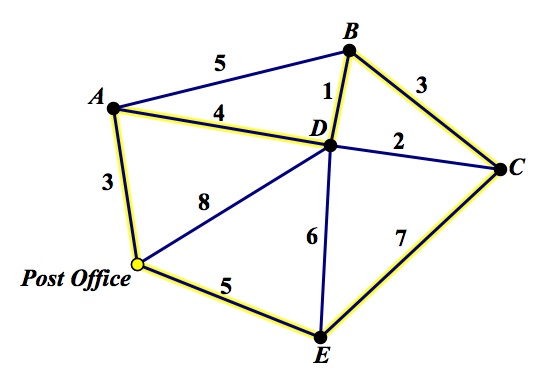
A mail carrier must make it to each of the houses in the graph below. What might the weights for this graph represent?
The weights on the graph above could represent the minutes it takes to get from one house to the next. It could be the gallons of gas that it takes him to get to each house. It could also be the number of miles between each house.
Example 2:
What would be the quickest path the mail carrier could take if the weights represent miles between each house? Which edges will you want to avoid using? How many miles long is that path?
The shortest path is above in yellow [(Post Office)ADBCE(Post Office)]. We wanted to avoid using 8, 7, and 6. However, in order to get to E were going to have to cross either 6 or 7 from D. It turns out that if we use 6 instead of 7 we would have to use 2. Yet, 2 + 6 is 8 which is more than 7 so it works in our favor to use 7 instead of both 2 and 6. The path above is 23 miles (3+4+1+3+1+7+5).
Student Work Period:
1. Using this GSP file, find the shortest path for the given graph.
2. Teachers may then allow access to this key so that students may check their work.
Homework:
Click here for the student worksheet. Click here for the key.
Day 4: Map Coloring
Goal: Students will be able to not only convert graphs to maps but also convert maps to graphs. They will also be able to color the maps using the chromatic number.
Vocabulary:
1. Map: the vertices of a graph become areas and edges are represented by touching perimeters of the areas (if two area are not touching on their perimeters then they do not have an edge connecting them in the graph).
2. Map Coloring: the coloring of a map such that no two areas which have touching perimeters are the same color
3. Chromatic Number: the least number of colors needed to correctly color a map
Concepts:
1. In order to make a map from a graph, the areas of two regions of the map must only share a portion of their perimeter if there is an edge between the corresponding vertices on the graph.
2. If two areas of a map only touch at a point, then there will not be an edge between the corresponding vertices on the graph which represents that map.
3. The chromatic number of any graph will never be more than 4.
Click here for a GSP file to use while going through the examples for Day 4.
Example 1:
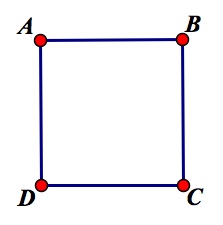
Convert this graph to a map.
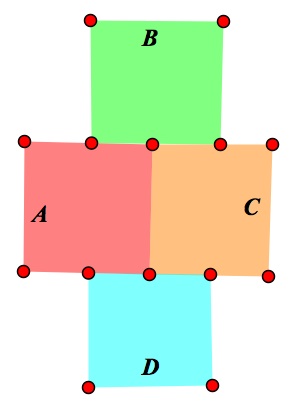
Below is one example of this graph as a map. As you can see above, there are edges between A and B and B and C. Thus, the green B area must be touching the red A area and orange C area. However, there is no edge between B and D; so, they are not touching. A and C both have an edge with D. Thus, the blue D area is touching both the red A area and the orange C area. A and C also share an edge and are therefore touching.
However, maps do not always have to be squares or rectangles. Below is a second example for another correct map for the graph above.
Example 2:
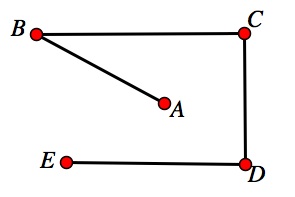
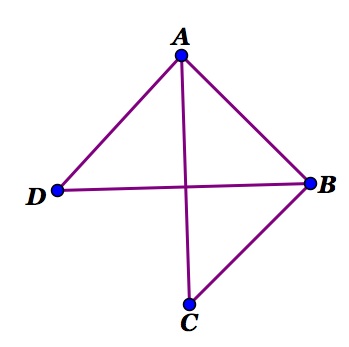
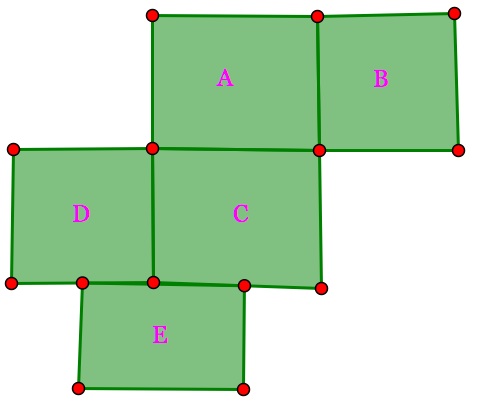
Convert the following map into a graph.
From the graph, we see that A shares perimeters with B, C, and D so there will be edges from A to each of the other three vertices. B shares perimeters with D and C as well so there will be edges from B to D and from B to C. D and C only touch at a point. Therefore, there is no edge between B and C. (See figure below)
Example 3:
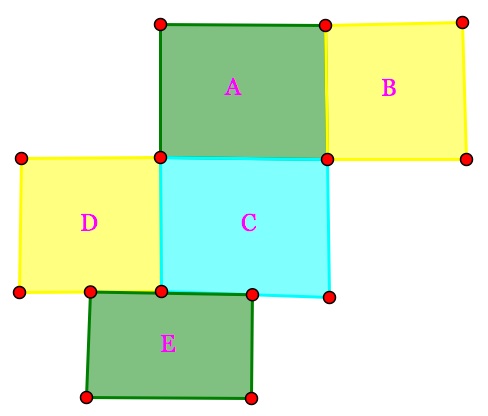
Color the following map. What is the chromatic number of this map?
Below is one example of a correct coloring of the map. A can not be the same color as B or C since they share borders. However, A and E can be the same colors and D and B can be the same colors since they do not share borders. C then shares a border with two other colors and must then be its own color. Thus, the chromatic number of this map is 3.
Proof of Concept #2: (Allow students to investigate what is the largest possible chromatic number before discussing the proof.)
In 1976, Kenneth Appel and Wolfgang Haken proved that there is no map which requires the use of 5 colors in order to be colored. Their proof was completed using an algorithm on a computer.
Student Work Period:
1. Complete this GSP file and save with your name.
2. Click here for some possible solutions.
Homework:
Click here for the student worksheet. Click here for the key.
Day 5: Vertex Coloring & Scheduling
Goal: Students will be able to correctly color the vertices of a graph and see how it relates to map coloring. Students will also be able to apply vertex coloring to scheduling application problems.
Vocabulary:
1. Vertex Coloring: the coloring of the vertices of a graph so that any two vertices which have an edge between them are different colors
Concepts:
1. Map coloring and vertex coloring are related in the since that two area of a map which are the same color will correspond to two vertices on a graph which do not have an edge connecting them.
2. If two events on a schedule need to be at the same time, then the vertices representing those two events need to be the same color and there should not be an edge connecting the two vertices.
Click here for a GSP file to use while going through the following examples.
Example 1:
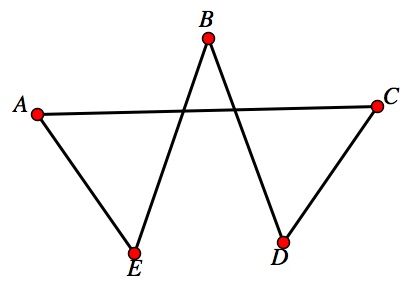
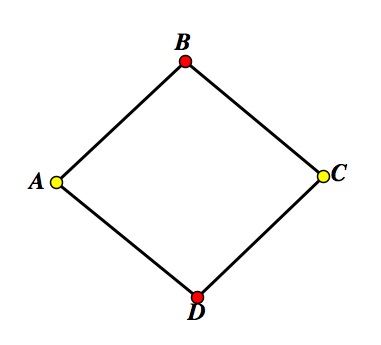
Color the vertices of the graph below.
We see that A shares an edge with B and D so A can not be the same color as B or C. However, A and C do not share an edge so they can both be yellow. B and D both can not be yellow as previously stated that they share an edge with A, yet B and D do not share an edge so they can both be the same color (red).
Example 2:
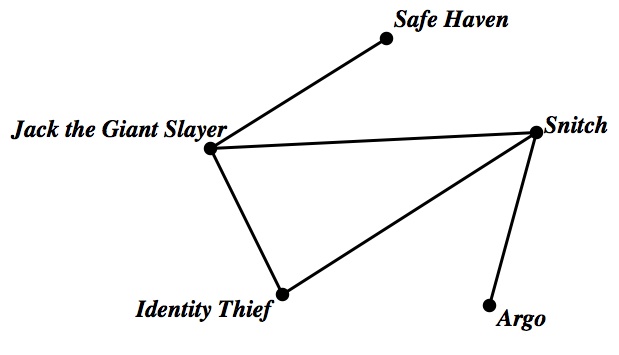
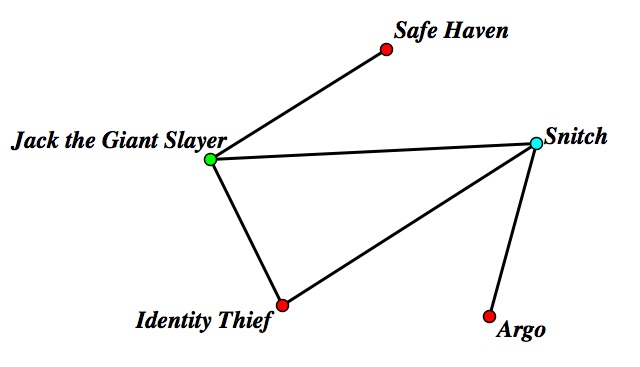
The local movie theatre is offering a buy one get one free deal where you can buy a ticket for one movie and see another one for free. Billy, Sarah, Jose, Michael, and Shavon are going to take advantage of this great deal. Five movies are being offered but there are only three times that movies will be shown. The movies being shown are Jack the Giant Slayer, Snitch, Safe Haven, Argo, and Identity Thief. Billy wants to see Jack the Giant Slayer and Identity Thief. Sarah wants to see Safe Haven and Jack the Giant Slayer. Jose wants to see Snitch and Argo. Michael wants to see Jack the Giant Slayer and Snitch. Shavon wants to see Snitch and Identity Thief. How do the kids need the movies to be scheduled so that they all get to see the movies that they want to see? Hint: Create a graph of the kids movie choices.
As we can see from the graph above, if one person wanted to see two movies then an edge was created between the two vertices which represented those movies. That will tell the scheduler that those movies need to be at different times. Thus, the graph below shows the graph with the appropriate vertex colors.
The colors show that Jack the Giant Slayer should be shown by itself in one time slot. Another time slot should show Snitch by itself. The other three movies (Safe Haven, Identity Thief, and Argo) can all be shown at the same time.
Example 3:
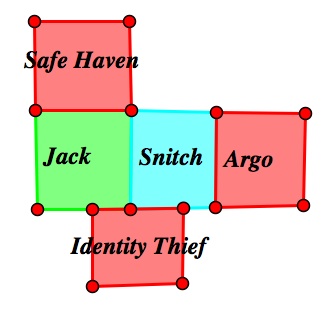
What would the above scheduling graph look like in a map?
Do you see the relationship between the map coloring and vertex coloring? Corresponding vertices and areas on the map are colored in the same way. The edges which cause two vertices to be different colors are represented by the shared portion of the perimeters on the map.
Student Work Period:
1. Complete this GSP file and save with your name.
2. Click here for the key.
Homework:
Click here for the student worksheet. Click here for the key.
Return