| To create a box plot, get back to the STATPLOT menu, and press enter as with the Histogram . Make sure that you highlight the box plot graph on the menu. You should be at the following screen: | 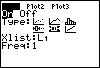 |
| Now use your ZOOM button and press 9. You should get the picture at the right. | 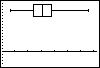 |
| Now use your TRACE button to find out information about the quartiles, the median, and the extremes. | 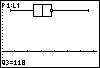 |