The T-Test Option
We will explore this option as we did with the Z-test
and work through an example. Again this example can be found in the
Bluman text.
An educator claims that the average salary of substitute
teachers in school districts in Allegheny County, Pennsylvania is less
than $60 per day. A random sample of 8 school districts is selected,
and the daily salaries are shown below. Is there enough evidence
to support the educator's claims at alpha=0.10?
$60, 56. 60, 55, 70, 55, 60, 55
If we choose our null hypothesis to be mu>=$60, and our alternative
hypothesis to be mu<$60 as is the claim, alpha at 0.10,
degrees
of freedom = 7, we fiind out the following information:
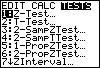
| Call up the STAT-TEST menu as shown. Choose option 2,
the T-Test. |
 |
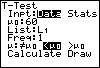
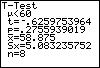
| Choose the data option and put in your value for mu. Choose the
calculate
option and you will see the t-value, p-value, and other statistics. |
  |
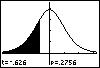
| Choosing the draw option gives the graph to the right.
Notice that the t, and p-values appear here as well. |
 |
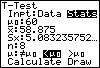
| Choosing the Stats option uses the summary statistics to help solve
the problem. By the way, since .27559>.10 the decision we
make here is to not reject the null hypothesis. |
  |
Main Page | Getting
Started | Graphical Displays
| Stat-Calc menu
Stat-Test menu | Probability
| Links