The function of
compared to
![]()
The above equations are different only by the term xy that has been added to the first equation. In this investigation we'll be having a look at how this term influences the the resulting graphs.
Please note: you might need a plugin to play the animations in this page.
Index:
1. The parabolic equation (Figure 1)
2. The hyperbolic equation (Figure 2a & Figure 2b)
3. The hyperbolic equation with different coefficients
The parabolic equation
![]()
This equation is a parabola that the following properties:
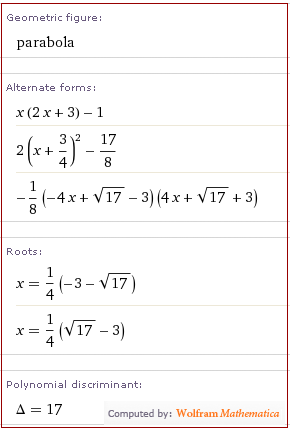
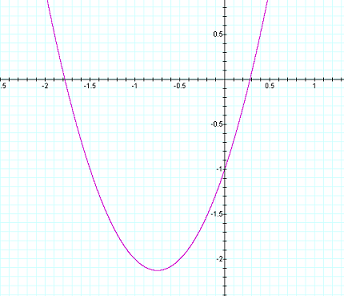
And here is the graph:
The hyperbolic equation
![]()
This hyperbola has the following properties:
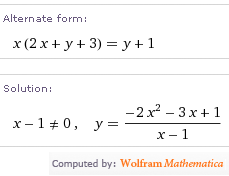
And generates the following graph (shown
on top Figure 1 for comparison):
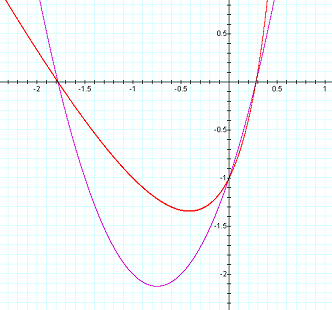
And now the same graph shown for a greater range (zoomed out):
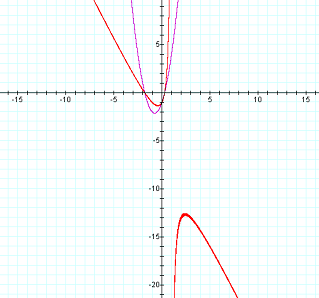
The first figure is misleading in that it appears at first to be some parabola, but figure 2b shows how this a hyperbola around x = 1.
Changing coefficients
![]()
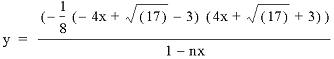
In the following investigation we'll be having a look at the effect of different values for the constant n. Note that solving for y yields a similar equation to the original hyperbolic equation with only the inclusion of n in the denominator:
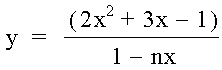
This coefficient n allows us to move the asymptote of the hyperbola:
By zooming out a bit, we can see the hyperbola's counterpart (inverse) more clearly:
Observations
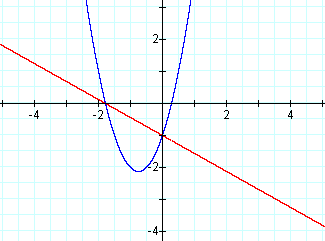
This video shows some interesting effects that n can have on the graph: when the asymptote goes through one of the zeroes of the parabola, the hyperbola is reduced to a line that intersects the parabola's y-intercept as well as the other x-intercept (other than the one that the asyptote passes through)
To get the graph in this form, we need to get it factored. Unfortunately the roots are irrational which makes a simple concept actually look quite involved:
![]()
becomes
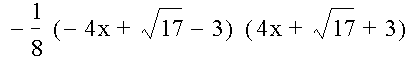
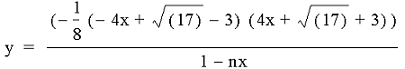
so, the hyperbolic equation can be written like this
The point of this exercise is to find the roots (or zeroes) of the parabola. Which, in this case,
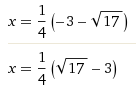
But, from the hyperbolic equation's denominator we get this equality (or relationship) between n and x:
1 - nx = 0
1 = nx
n = 1/x
x = 1/n
Using this relationship between x and n (x is n's inverse and vice versa) we can pick a n such that
n = 1/(root of x)
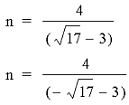
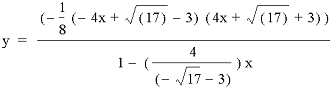
These two values of n cause the denominator to equal either one of the two factors in the numerator. In either case, the factor cancels out with the denominator leaving us with the other factor as the sole linear equation. The following two equations show the effect that these two values of n have on the hyperbola (the only difference in these two equations is the minus sign in front of the root of 17):
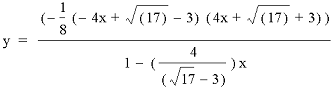
And similarly the setting n as the inverse of the other root:
One last observation concerns what happens when n is equal to zero.
setting n = 0 implies
1 - nx
= 1 - (0x)
= 1 - 0
= 1
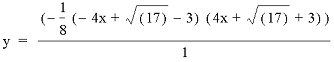
This gives us the original parabola, so if n approaches zero, this graph approaches the original parabola.
Putting it all together
The top (quadratic) part of this equation can be factored into two linear parts. The denominator has a constant n that can be used to investigate the hyperbola. The asymptote is where 1 - nx equals zero, this is also where x = 1/n. This gives us a few partitions, let the roots be r1 and r2 (i.e. if x = r1 or x2 then the y = zero).
On a number line we have: infinity, r1, 0, r2, infinity, then
n < r1 : As n approaches negative infinity, the asymptote approaches zero from the left.
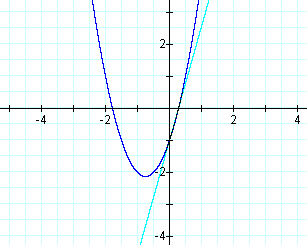
n = r1 : y = linear function equaling one of the parabola factors (This is the red line below)
r1 < n < 0 : As n approaches zero, the asymptote approaches negative infinity.
n = 0 : the hyperbola is equal to the parabola
0 < n < r2 : As n approaches 0, the asymptote approaches infinity
n = r2 : y = linear function equaling one of the parabola factors(This is the light blue line below)
n > r2 : As n approaches infinity, the asymptote approaches zero from the right.
Keep your eye on the grey line, this is the asymptote x = 1/n.
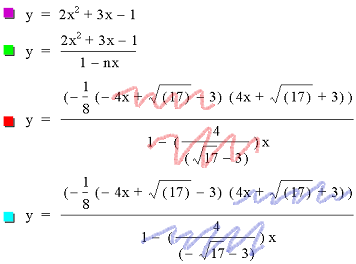
Algebraically this video shows:
The purple equation is the parabola
The green equation is the hyperbola with shifting n
The red equation is the line left over after one factor is canceled out by picking n = 1/(root of x)
The light blue equation is the same principle as the red one, only applied to the other factor.
In closing
I hope this investigation has shown some of the connections that can be made between the hyperbola and the parabola, by making use of technology.