The Quadratic Function
looked at through the bx-plane, the cx-plane and the ax-plane
October 22, 2010
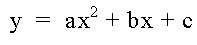
The quadratic equation represents a relationship between y and x, and this relationship is effected by the values we chose for a,b and c. In this investigation we'll have a look at the effects of a, b and c in the normal Cartesian system of the xy plane, and also in the ax, bx and cx planes.
Please note: you might need a plugin to play the animations in this page.
Index:
2. The xb plane
3. The xa plane
4. The xc plane
5. All together
1. The coefficients a, b and c
Moving
a
The following four equations will be graphed simultaneously in the xy plane. The n coefficient is used as a moving number: it will move between the values 3 and -3 in a 100 steps.
The values b and c each have the value of one.
The red line is the value of n, shown as a line through the y axis at the value of n
The blue, green and light blue equations are three different parabolas at a = 3, a = 0 and a = -3.
Look at how the purple graph moves from one to the other as n goes from 3 to -3 and back again:
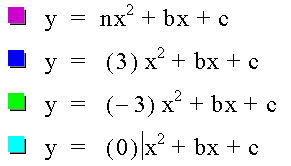
NOTICE that the light blue function is the linear function y = bx + c. Why is this?
Moving
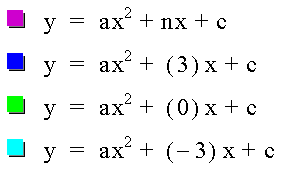
b
Now we repeat this process but with a and c each having the value of 1 and b (represented by n in the purple equation) will be moving through all the values from 3 to -3 and back for b.
The red line is the value of n, shown as a line through the y axis at the value of n
The blue, green and light blue equation are the equations where a nd c is 1 and b is respectively b = 3, b = 0 and b = -3.
Moving
c
Now we repeat this process once more but with a and b each having the value of 1 and c (represented by n in the purple equation) will be moving through all the values from 3 to -3 and back for c.
The red line is the value of n, shown as a line through the y axis at the value of n
The blue, green and light blue equation are the equations where a and b is 1 and c is respectively c = 3, c = 0 and c = -3.
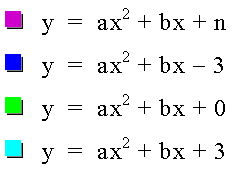
NOTICE how the red line is always through the y intercept of the parabola.
2. The xb plane
There is another way of looking at what happens in the with regards to changing the b coefficient: the xb plane.
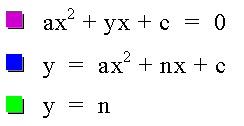
The easiest way to visualize the xb plane is to substitute b with y and graph it. By setting the equation equal to zero we have essentially asked:
Show all the possible roots for this equation in one graph.
And it looks like this:
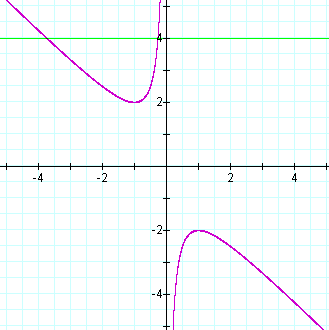
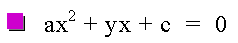
FIGURE 1
Figure
1 shows the above-mentioned equation, the green line is the line y = 4,
or more specifically in our case b = 4 actually. It can be interpreted
as follows: the points where the green line
cuts the purple graph is exactly the roots of the parabola with b = 4
(and assuming that a = 1, c = 1 - we do this because the coefficients
influence each other)If we were to draw the real parabola (a = 1, b = 4, c = 1) in the xy-plane, it would look like this:
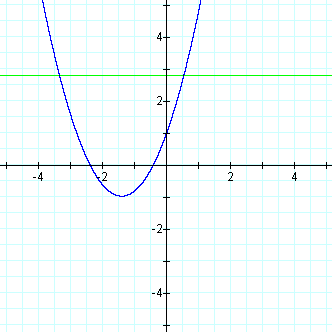
FIGURE 2
We can even overlap these graphs by putting the xb-plane on top of the xy-plane:
FIGURE 3
Notice in figure 3 how the
point of intersection with the green and the purple graph
intersect is exactly above the intersection of the blue graph (the
actualy parabola) with the x-axis.
Here is another example of the same thing, now the green line (y = b) is below the x - axis:
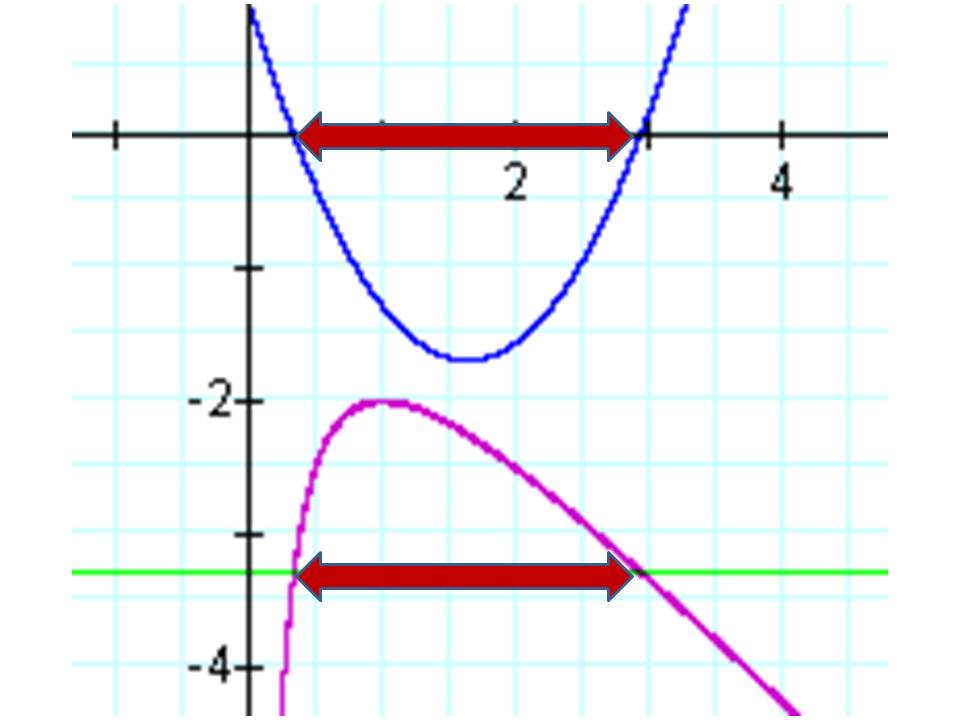
FIGURE 4
Here is another example of the same thing, now the green line (y = b) is below the x - axis:
FIGURE 4
In the following video we
have these two overlapped graphs. Notice how the intersection of the
green line (y = b) and the purple graph (all parabola intersections) is
exactly the roots of the actual (blue) parabola. Notice especially that
there are not roots when b (the green line) is between -2 and 2, this
qualifies as complex roots, or non-real roots of the parabola.
The equations are as follows: a and c and set equal to 1 and n is the changing value of b.
The equations are as follows: a and c and set equal to 1 and n is the changing value of b.
NOTICE how the red line is always through the y intercept of the parabola.
3. The xa plane
Now we repeat the same process for a in the ax-plane and overlap it with the xy-plane just as above. The green line is the changing values of a, the purple graph represents the roots of the parabola and the blue graph is the actual parabola.
The equations look like this:
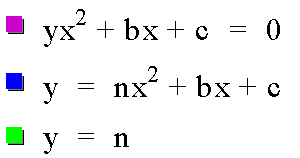
And the graphs look like this:
4. The xc plane
The simplest one comes last. We repeat the exact same processes as above for a and b: c is the moving value from -3 to 3, a and b is equal to 1. We overlap the xc-plane with the xy-plane to give us a green line representing the changing value of c, a purple graph in the xc-plane representing all the roots of the actual parabola, and finally this actual parabola itself.
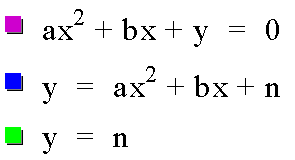
These are the equations (with n representing the changing value of c):
And this is the graph:
5. All together
This last part is an attempt at showing how these coefficients are interrelated, meaning that when b changes from 2 to 3, that has an effect on a and c. The video is the overlapping of all the above-mentioned planes but it is different because all of the coefficients will be changing in unison.
That means b=1, a=1 and c=1 at some point but then it will move on to say b=1.2, a=1.2 and c=1.2 and so on. This change will effect every plane in some way. This is an oversimplification because it is rare for a=b=c with parabolas, to show all the planes in their own right and their relationships to each other would require more than a mere 2 dimensions!
Here are the equations:
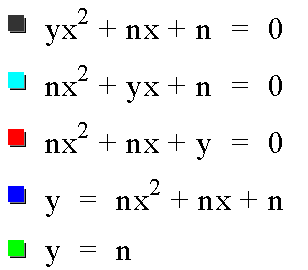
- The dark gray graph is the ax-plane
- The light blue graph is the bx-plane
- The red graph is the cx-plane
- The blue graph is the actual parabola
- The green line is the value of n
Again: if n = 2 for instance, then a = 2, b =2 and c = 2
Here's a picture of what this will look like when n=0.8 (almost 1):
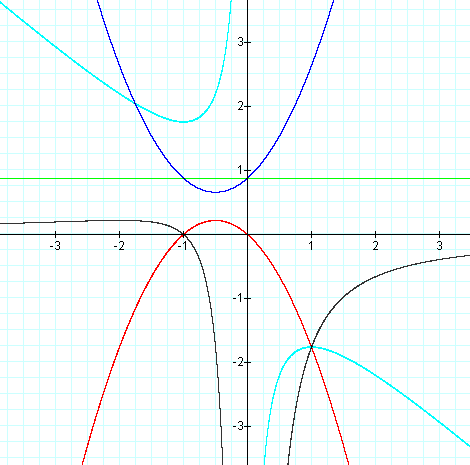
FIGURE 5
Notice:
This is what the video looks like:
- The green line is y = n which is 0.8 in this case
- Light blue is the bx-plane with no intercepts with the green line and therefor no roots
- The same is said for the dark gray ax-plane and the red cx-plane
This is what the video looks like:
In closing
I hope this investigation has shown some of the connections that can be made concerning the coefficients of the parabola, by making use of technology.